11 Jan

Rowing data can improve your performance – if used correctly. But common mistakes like misinterpreting metrics or inconsistent tracking can hold you back. Here’s a quick guide to avoid errors and make the most of your data:
- Misunderstanding Metrics: Know how stroke rate, split time, and power output affect training.
- Inconsistent Logging: Track every workout to monitor progress and recovery.
- Over-Reliance on One Metric: Use multiple metrics (e.g., heart rate zones, power output) for a balanced view.
- Ignoring Long-Term Trends: Regularly review trends to spot improvements or plateaus.
- Poor Equipment Calibration: Keep your rowing machine calibrated for accurate data.
Quick Comparison of Mistakes and Fixes
| Mistake | Impact | Fix |
|---|---|---|
| Misinterpreting Metrics | Unfocused training | Learn how to use stroke rate, split time, and power effectively. |
| Inconsistent Logging | Unreliable progress data | Use tools like ErgMonkey or Concept2 Logbook to log consistently. |
| Single Metric Focus | Training imbalance | Track multiple metrics for a complete performance picture. |
| Ignoring Trends | Missed improvements | Analyze data monthly to adjust your training plan. |
| Poor Calibration | Inaccurate performance | Check drag factor and update firmware regularly. |
Start by understanding these mistakes and applying the fixes to train smarter, improve faster, and avoid plateaus.
Rowing Metrics Explained
Mistake 1: Misunderstanding Key Metrics
Misreading key metrics can derail your training progress and lead to ineffective decisions. The most often misunderstood metrics are stroke rate, split time, and power output.
How Misinterpreting Metrics Affects Training
Each metric plays a specific role in your performance, and misunderstanding them can have serious consequences:
| Metric | Effect on Training |
|---|---|
| Stroke Rate | Leads to wasted energy and early fatigue |
| Split Time | Results in poor pacing and inconsistency |
| Power Output | Causes inefficient energy use or injuries |
How to Use Metrics the Right Way
To improve your training, it’s crucial to understand how these metrics work together and what they mean for your performance:
1. Get a Handle on Stroke Rate
Stroke rate isn’t just about going faster. Focus on maintaining steady power with each stroke rather than simply increasing your rate. This helps you conserve energy and avoid burning out too quickly.
2. Make Sense of Split Times
Split times should be evaluated based on your fitness level, workout goals, and recovery status. They’re a tool for pacing, so always consider the bigger picture.
3. Manage Power Output Carefully
Increasing power output is important, but it must be done with proper technique. Otherwise, you risk wasting energy or even injuring yourself.
Using tools to track and analyze metrics over time can make a big difference. Regularly reviewing your data allows you to spot trends and adjust your training plan. When you fully understand these metrics, every stroke you take will bring you closer to your goals.
Mistake 2: Inconsistent Workout Logging
Skipping or irregularly logging your workouts can make it tough to track progress or pinpoint areas for improvement. Keeping detailed and consistent records helps you better understand your performance and adjust your training as needed.
Why Consistent Tracking Matters
When your workout data is incomplete, you miss out on key insights like:
| Area | Why It Matters |
|---|---|
| Progress Tracking | Hard to see how much you’ve improved over time |
| Training Load | Challenges in balancing workout intensity effectively |
| Recovery Patterns | Overtraining or insufficient recovery might go unnoticed |
| Performance Trends | Gaps in data make it harder to spot long-term changes |
Consistent records give you a clearer view of your progress and help fine-tune your approach.
How to Stay on Top of Logging
Digital tools like ErgMonkey ($39.99/year) and the Concept2 Logbook make it easier to stay consistent. These tools offer features like workout history, heart rate tracking, and performance trends. To avoid forgetting, log your data right after each session. Focus on key metrics like split times, heart rate zones, power output, distance, and duration to build a complete picture of your performance.
Once your logging is reliable, make sure you’re regularly analyzing the data to get the full benefit – don’t rely on just one metric to guide your training.
Mistake 3: Over-Reliance on a Single Metric
Relying too heavily on one metric, like split time, can create gaps in your training. It might cause you to overlook areas like technique, recovery, or endurance, which are crucial for overall improvement.
Risks of Focusing on One Metric
When you zero in on just one metric, it can throw off your training balance. Here’s how:
| Risk | Training Impact |
|---|---|
| Technique Deterioration | Prioritizing pace might lead to poor form |
| Training Imbalance | Ignoring endurance metrics can hurt stamina |
| Overtraining | Missing recovery signs increases the risk of burnout |
| Limited Progress | Overlooking power metrics may hide inefficiencies |
Solution: Track Multiple Metrics
To get a complete picture of your performance, monitor a variety of metrics. This ensures you’re training effectively, maintaining proper form, and improving over time.
Some key metrics to focus on include:
- Heart Rate Zones: Live heart rate tracking helps you stay in the right intensity range. The PM5 monitor is a great tool for balancing effort and recovery.
- Power Output: Measure power relative to your body weight (watts per kilogram) to track efficiency and progress.
- Stroke Rate: Aim for a controlled stroke rate (18–24 SPM) while maximizing power with each stroke.
"By paying attention to these metrics and working to improve them, you’ll start to see tangible results in your rowing performance and overall fitness."
- Mac Evans, former D1 Collegiate Rower
Combining metrics like stroke rate, power output, and heart rate zones gives you a well-rounded view of your performance. Avoid getting stuck on one number – diversifying your focus will keep your training balanced, effective, and aligned with your goals.
sbb-itb-1725142
Mistake 4: Neglecting Long-Term Trends
Paying attention to long-term trends helps rowers fine-tune their training and avoid hitting a plateau. When combined with a clear understanding of key metrics, this approach allows for a smarter, more tailored training plan.
Why Long-Term Trends Matter
Looking at trends over time reveals insights that a single workout can’t provide:
| Metric | Insights from Trends |
|---|---|
| Performance (Split Times & Power) | Progress and efficiency over time |
| Heart Rate Zones | How your cardiovascular system is adapting |
| Stroke Rate | Consistency in technique |
These trends highlight changes in performance, recovery needs, and potential plateaus, guiding better training decisions.
How to Analyze Trends Effectively
Using digital tools like ErgMonkey ($39.99/year) can make tracking trends easier. Features like ‘Workout Trend Reports’ and ‘Heart Rate Zone Analysis’ help you see how you’re progressing and where you might need to adjust.
"By analyzing long-term trends, rowers can identify specific metrics that are not improving or are declining. This allows them to focus their training on areas that need the most attention, leading to more efficient and effective workouts."
Here’s how to make the most of trend analysis:
- Log every workout consistently (refer to Mistake 2 for tips).
- Review your data monthly to spot patterns.
- Compare your performance to benchmarks to track progress.
Accurate equipment calibration is just as important as tracking trends. Without it, the data you rely on might not reflect your actual performance.
Mistake 5: Incorrect Equipment Calibration
Failing to calibrate your rowing machine properly can throw off your training and skew your performance data. Unfortunately, this step is often overlooked, leading to poor decisions based on flawed metrics.
How Calibration Errors Impact Your Training
When your rowing machine isn’t calibrated correctly, everything from your workout effort to performance analysis can go off track. Here’s how specific calibration issues affect your training:
| Problem | Result |
|---|---|
| Wrong Drag Factor | Misleading power readings, making effort levels inconsistent |
| Outdated Firmware | Inaccurate metrics that distort performance reviews |
| Lack of Maintenance | Fluctuating resistance, causing unreliable split times |
These errors can trick you into thinking you’re improving when you’re not, leading to misguided adjustments in your program. Accurate calibration ensures your data stays reliable and actionable.
How to Keep Your Machine Calibrated
Stick to these simple practices to keep your equipment in top shape:
- Check calibration monthly – set a reminder so you don’t forget.
- Keep the drag factor between levels 4–6 for consistent data.
- Update the firmware regularly to avoid tracking errors.
Helpful tools to guide you:
- Concept2 Logbook: Offers step-by-step calibration and maintenance instructions.
- ErgMonkey: Tracks calibration status directly on your machine.
With a properly calibrated rowing machine, your data becomes a trustworthy tool for making smarter training decisions and avoiding the pitfalls of inaccurate readings.
Conclusion: Getting Better Results with Accurate Data
Key Takeaways
Accurate data is essential for effective rowing training, yet many athletes face common mistakes that hinder their progress. Tackling the five major errors listed below can turn your rowing data into a game-changer for improving performance.
| Mistake | Impact on Training | How to Fix It |
|---|---|---|
| Misinterpreting Metrics | Training at wrong intensity | Learn how to correctly use pace, power, and heart rate data |
| Inconsistent Tracking | Missing key performance trends | Use digital tools to automate and ensure consistent logging |
| Focusing on One Metric | Overlooking the bigger picture | Track multiple metrics for a well-rounded view |
| Ignoring Trends | Missing areas for improvement | Regularly analyze trends with reliable tools |
| Poor Equipment Calibration | Data becomes unreliable | Perform monthly checks and maintenance |
These fixes work together to create a solid, data-driven approach to improving rowing performance.
What Rowers Should Do Next
To make the most of your training, start applying these strategies today:
- Build a Strong Data System: Use ErgMonkey’s Standard plan to access features like heart rate zone tracking and workout comparisons.
- Schedule Regular Reviews: Dedicate 15 minutes each week to analyze your data and spot patterns using tools like the ErgMonkey Workout Trend Report.
- Use the Right Tools: Platforms like Concept2 Logbook and ErgMonkey simplify data tracking and help you analyze key performance metrics with ease.
"Accurate data is the key to identifying weaknesses, tracking progress, and optimizing training plans."
Additional Resources for Data Analysis
If you’re looking to tackle common data challenges like tracking errors and trend analysis, these tools can help streamline your process and improve performance insights.
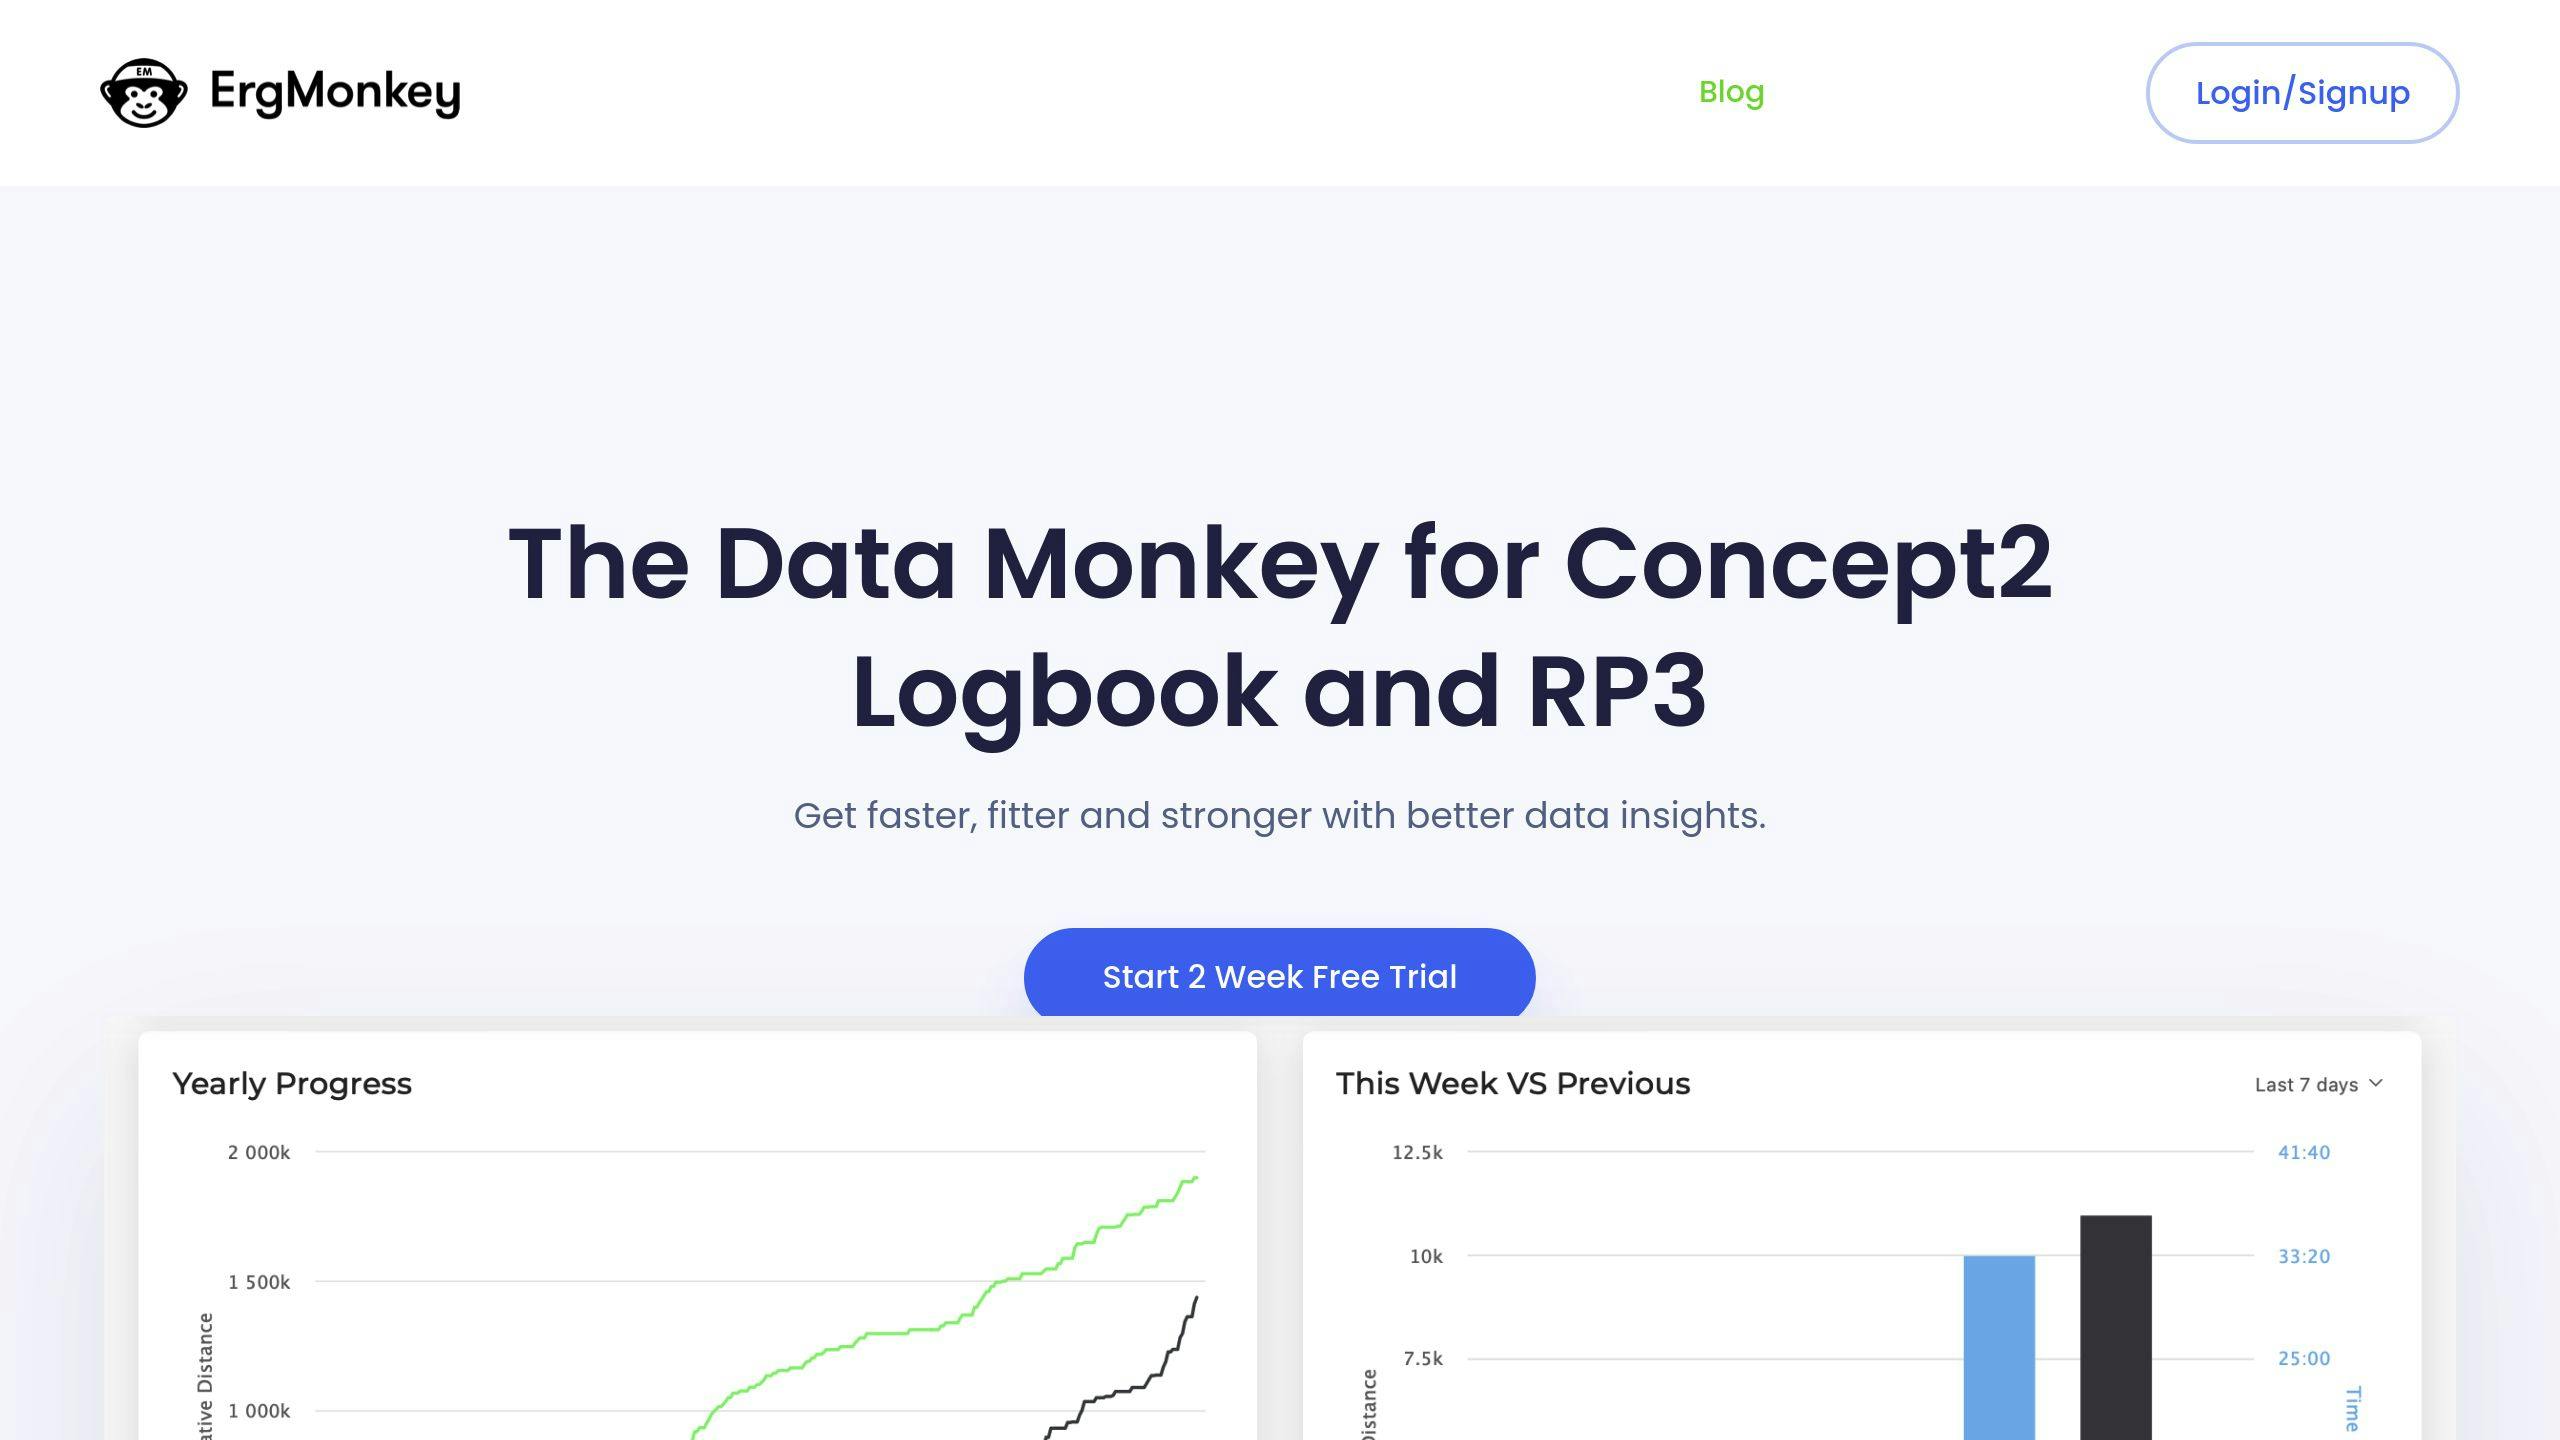
ErgMonkey

ErgMonkey provides three subscription plans, each tailored to meet different rowing data needs:
| Plan | Price | Features for Data Analysis |
|---|---|---|
| Lite | $19.99/year | Tracks basic workouts, 365-day history, and a dashboard summary |
| Standard | $39.99/year | Full history, heart rate zones, workout comparisons, trend reports |
| Plus | $49.99/year | Includes Standard features plus calendar planning tools |
The Standard plan is particularly useful for addressing common data issues, offering features like trend reports and heart rate zone tracking.
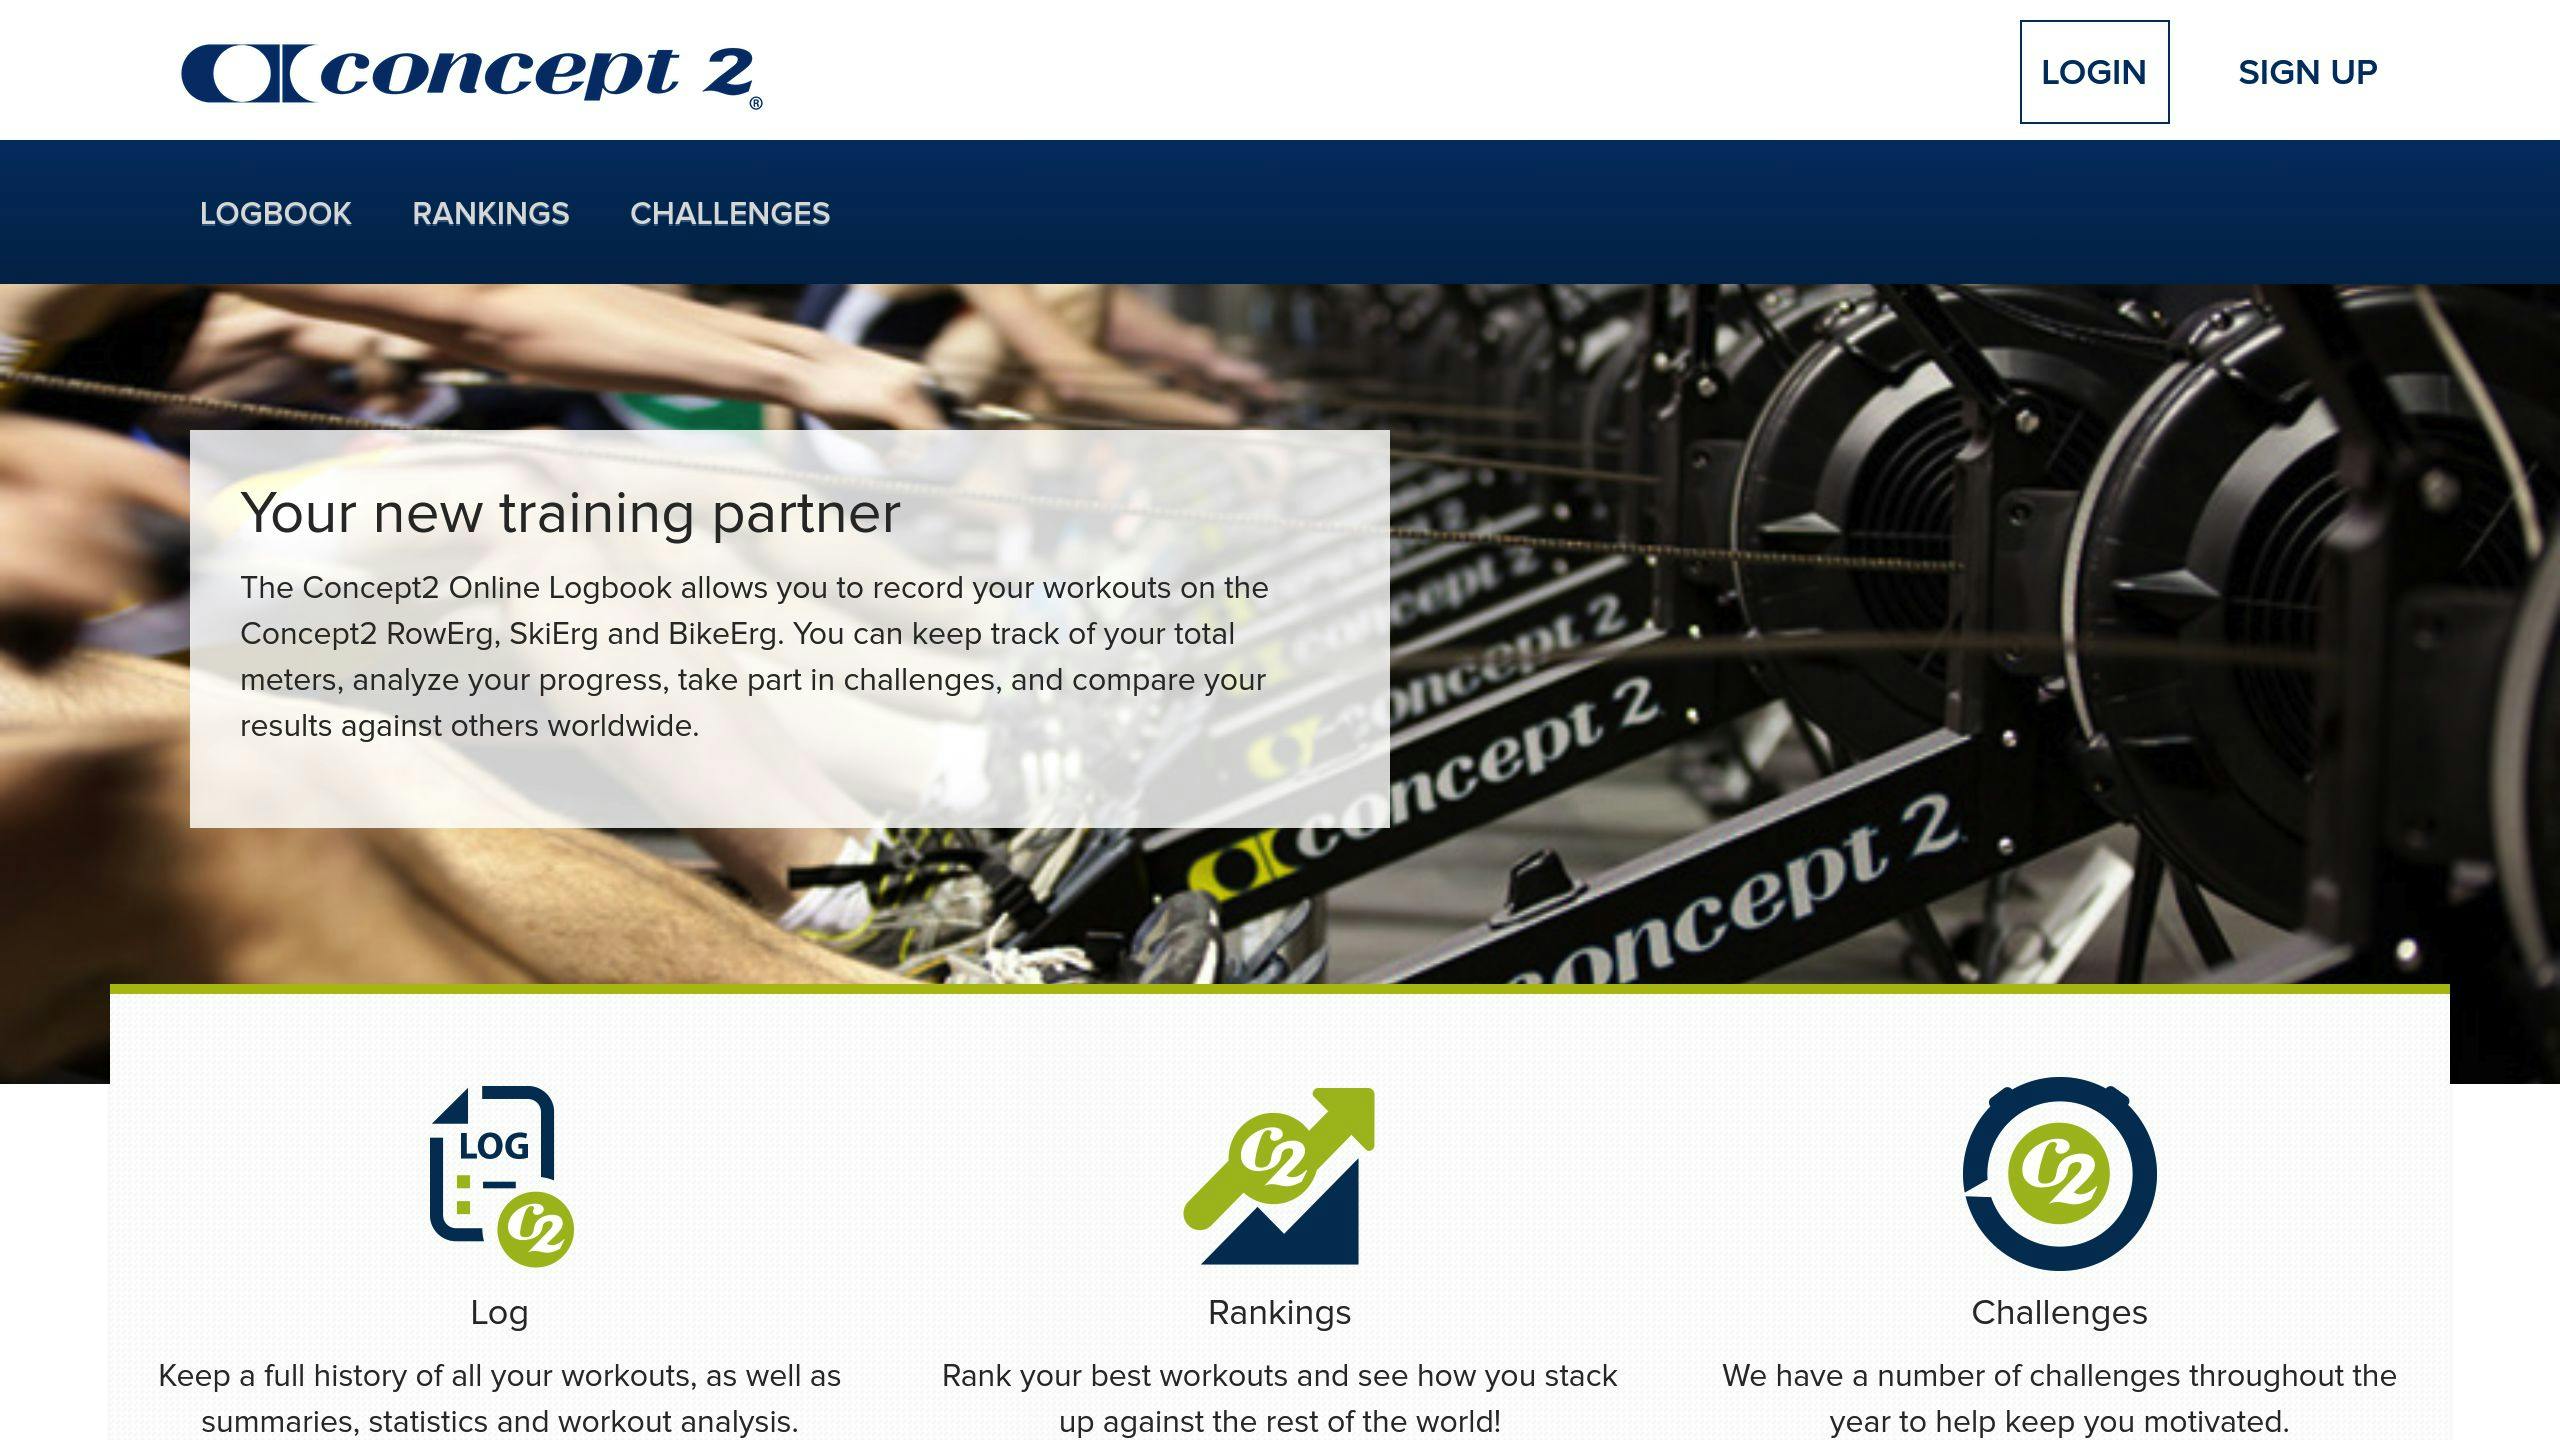
Concept2 Logbook

The Concept2 Logbook is a free option for precise data recording. It integrates smoothly with ErgMonkey, creating a powerful combination for data collection and analysis. Together, these tools provide the insights you need to make better training decisions.
FAQs
What heart rate zone should I be in while rowing?
Getting your heart rate zones wrong can throw off your training. The right zone depends on the workout you’re doing. For steady-state rowing, aim for 55% to 80% of your maximum heart rate.
Here’s a quick guide to rowing heart rate zones:
| Workout Type | Heart Rate Zone |
|---|---|
| UT2 (Endurance) | 55-70% |
| UT1 (Tempo) | 70-80% |
| AT (Threshold) | 80-85% |
"Training in the right heart rate zone is crucial for maximizing the effectiveness of your workout and avoiding overtraining."
For steady-state sessions, stick to these zones for 30-80 minutes. If you’re doing UT2 training, going above the range can hurt your endurance progress.
To stay on track:
- Use a stress test for accurate zones instead of relying on the 220-minus-age formula.
- Monitor your heart rate with a reliable device and keep a log.
- Take advantage of tools you already have to keep your heart rate data consistent.

