The Data Monkey for Concept2 Logbook and RP3
Get faster, fitter and stronger with better data insights.
Start 2 Week Free Trial
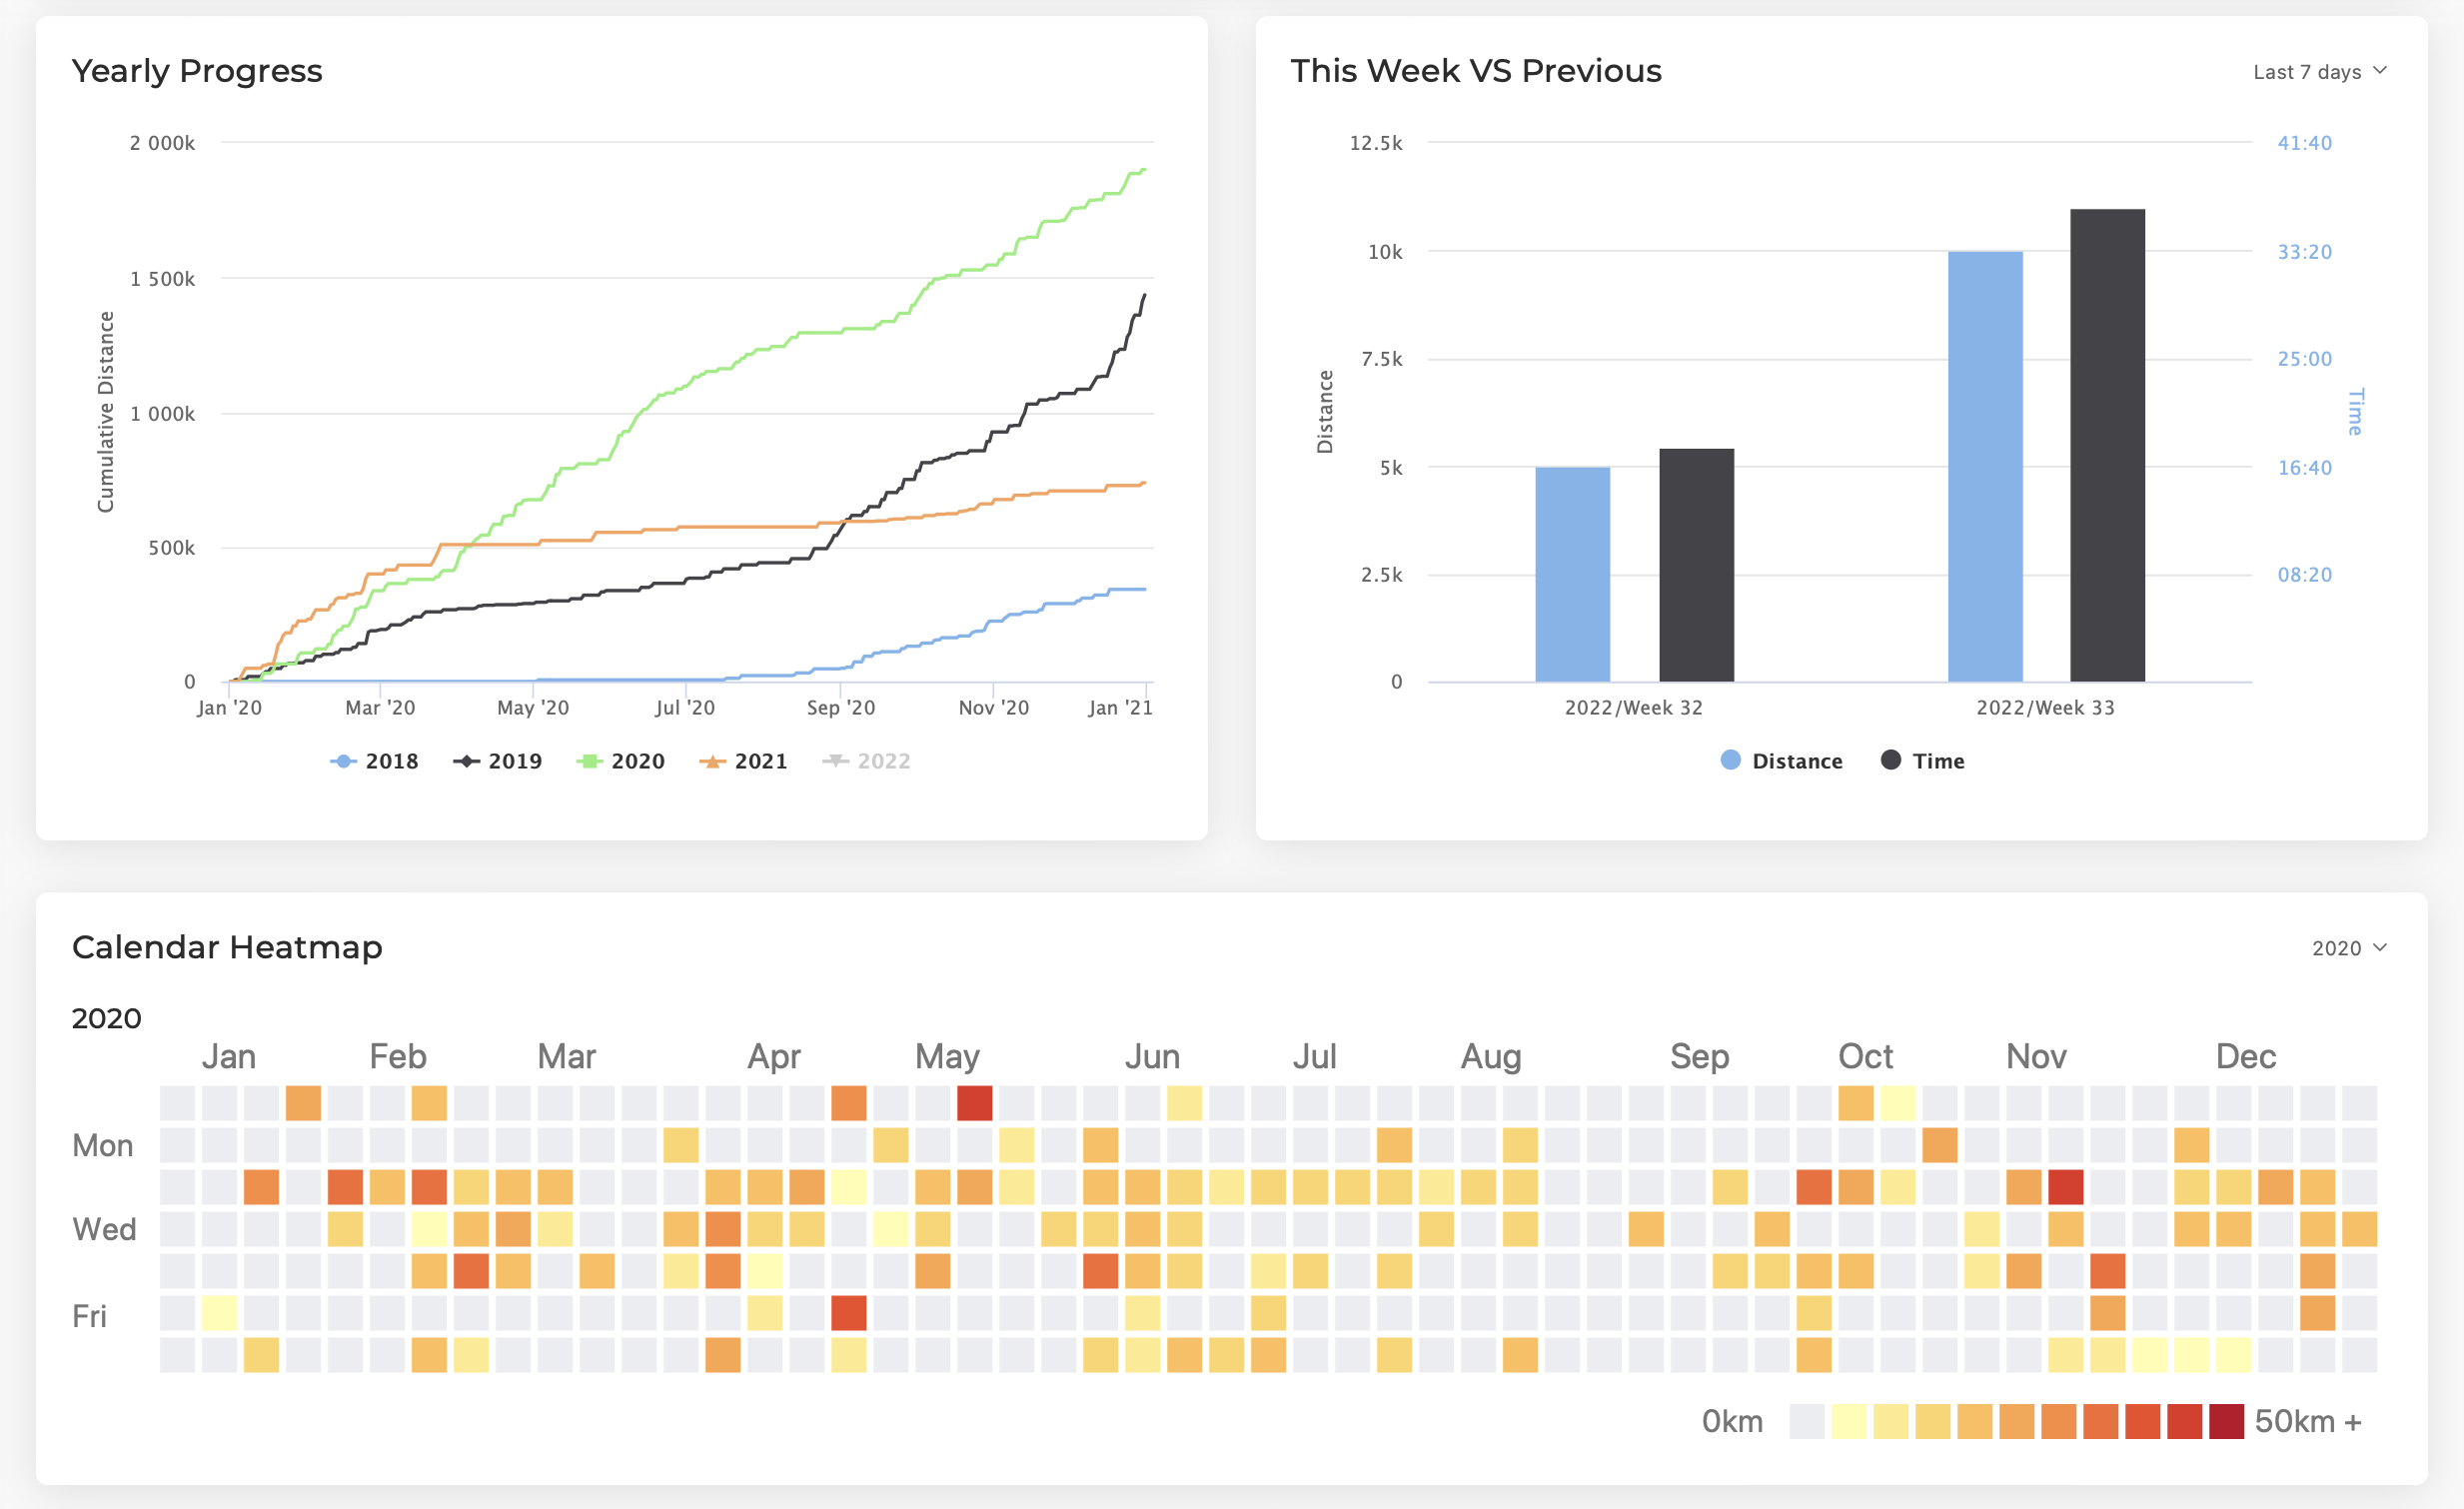
Get more from your workout data
Import your Logbook/RP3 data to get better insights of your training and performance
We've been trusted to process 100,000+ workouts over the last 2 years.
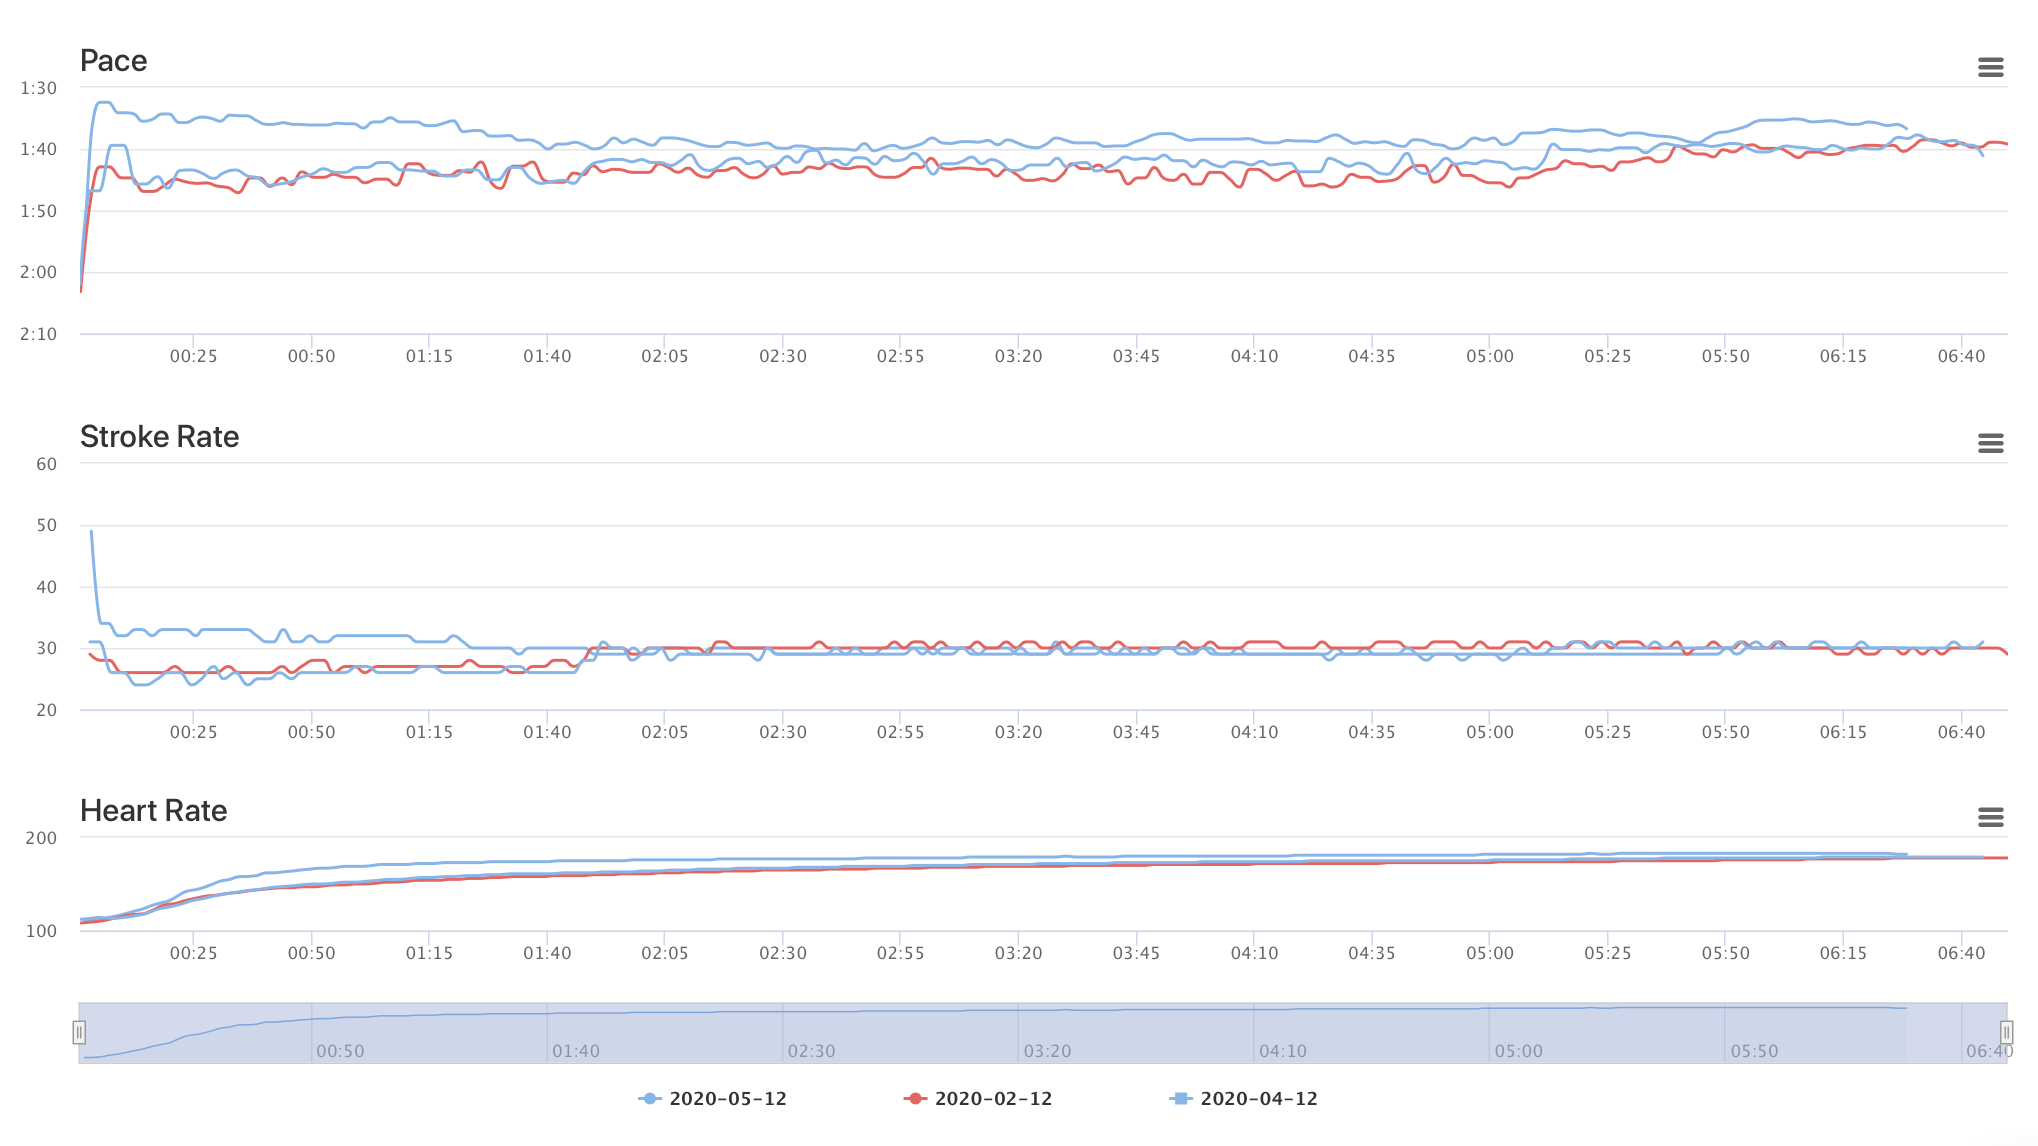
Compare any workout
Select any workout you’ve completed multiple times and compare them against each other on the same page.
See the difference in your pace, stroke rate and heart rate.
The image is an example of 3 x 2000m


Is your training working?
You’ve done hundreds of workouts but how do you know if you’re really getting any better?
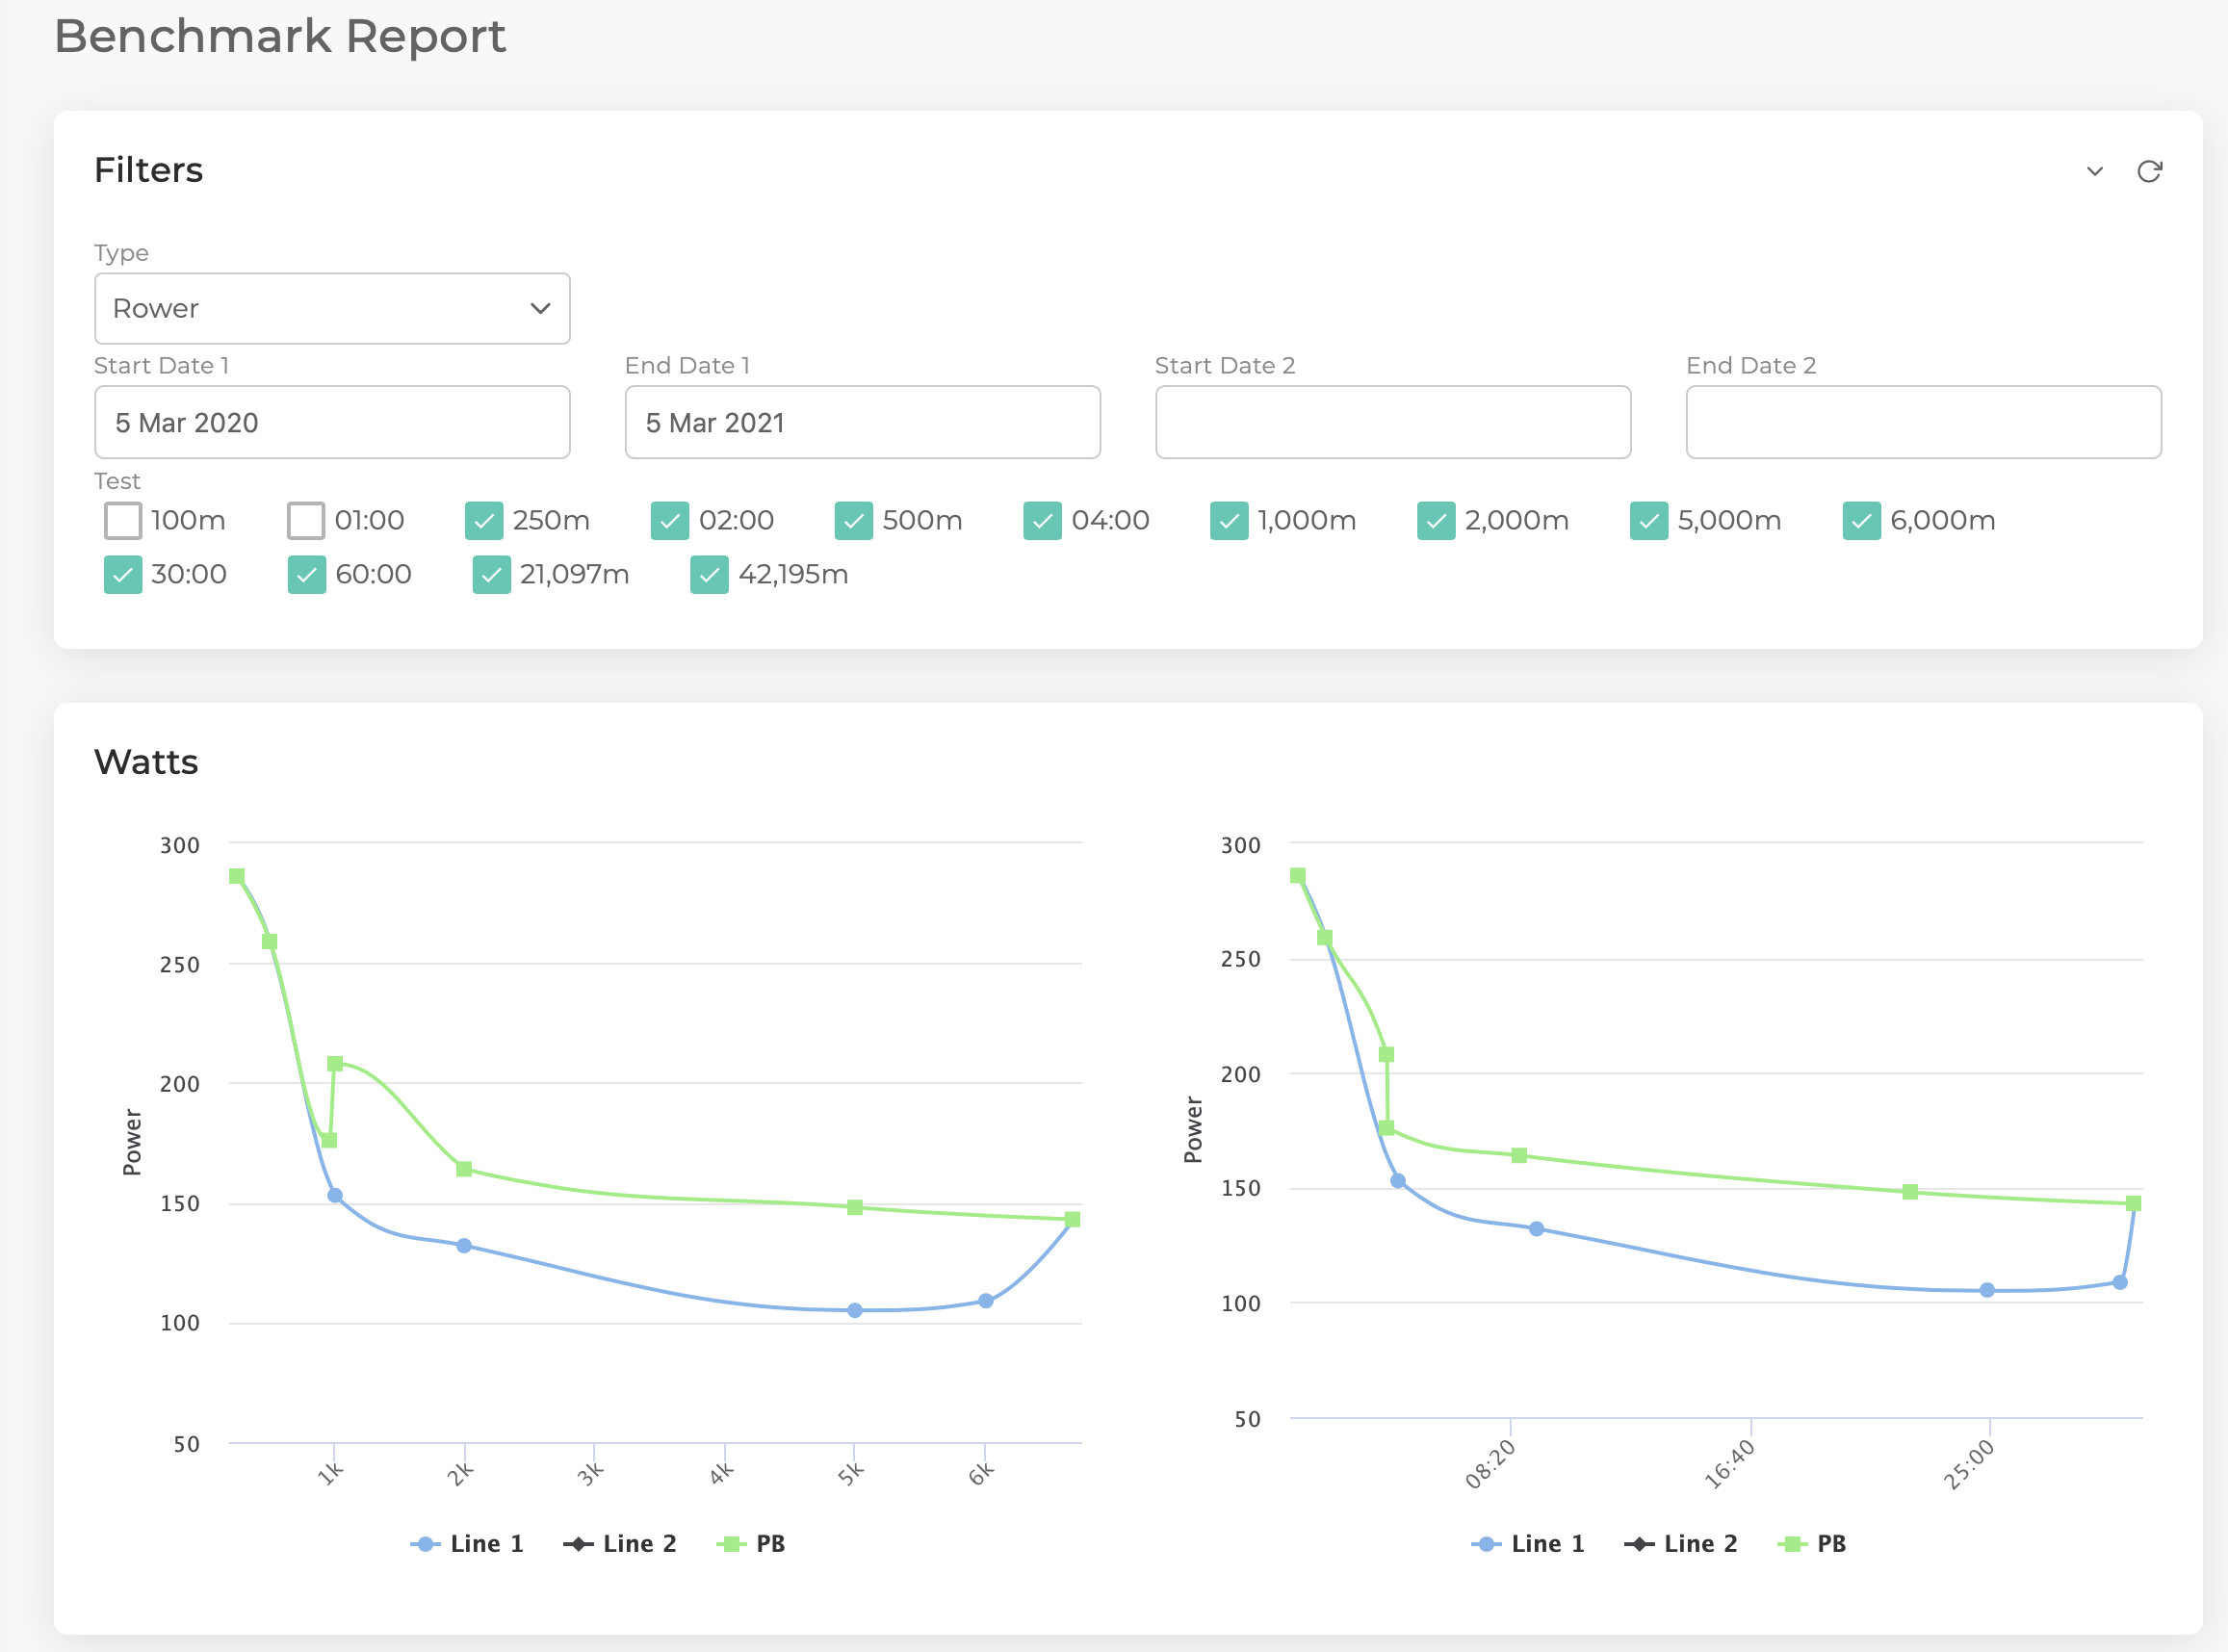
Our Power Report lets you compare the 2 periods of time against each other.
For both graphs power is on the x-axis.
The left graph shows all distance workouts.
The right graph shows all time workouts.
The line drawn is the average power for workouts in each period.
Use all your data to help you go faster
You’ve done all the hard work on each workout. We’re
here to help you use all of it in a simple format.
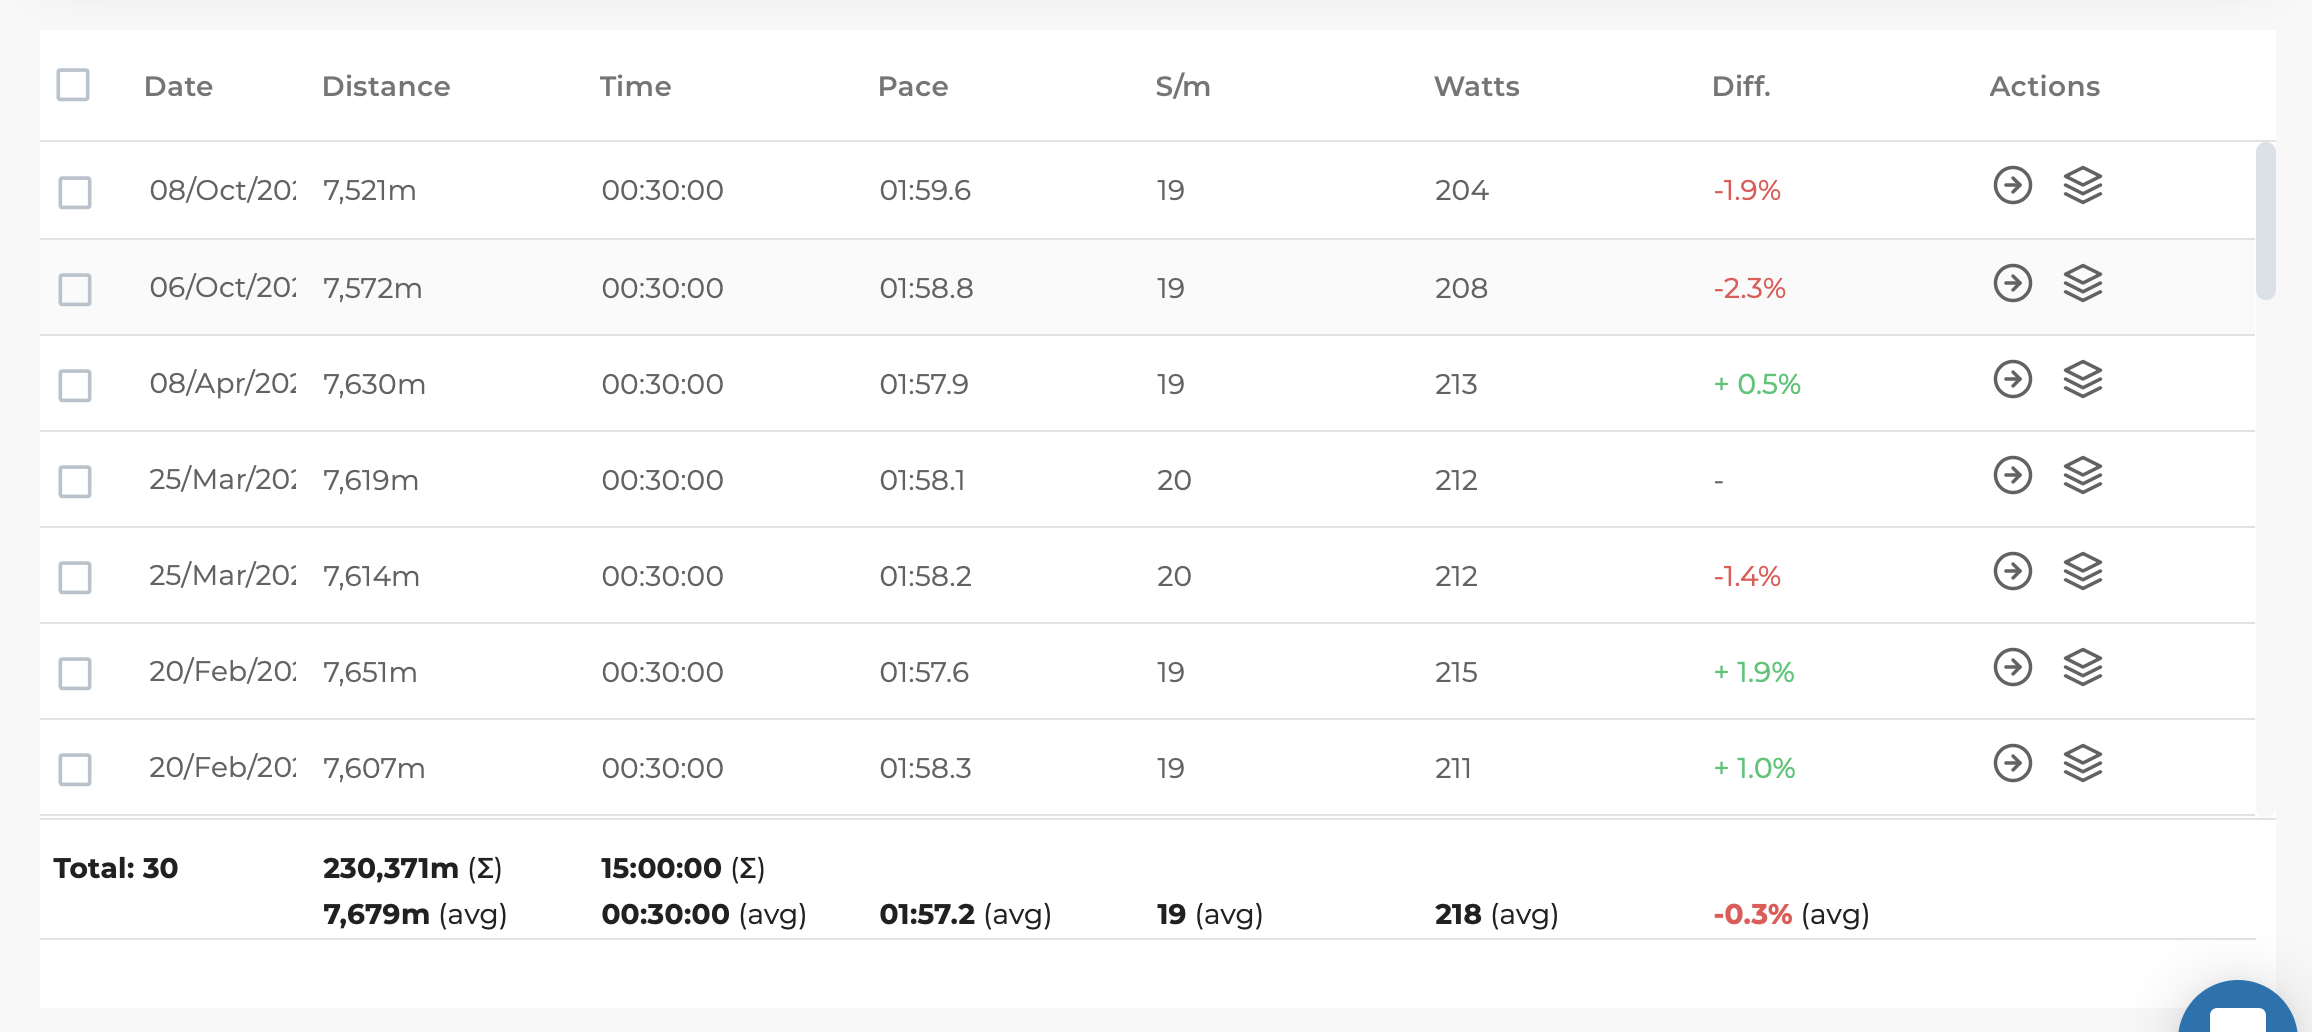
This table is an example of the history of 30 minutes.

Apps that work with ErgMonkey and we
All the apps listed below integrate with either Concept2 Logbook or RP3 Rowing Platform
meaning you can use them with ErgMonkey.
Pricing Plans
All new accounts include a 2 week free-trial of Plus Plan.
No credit card required. 30-day money-back guarentee.
Lite
- 365 Day History
- Dashboard Summary
- Basic Workout Summary
- Stats Report
Standard
- View Entire History
- Dashboard Summary
- Basic Workout Summary
- Stats Report
- Comparison Report
- Workout Comparison
- Heart Rate Zones
- Heart Rate Report
- Benchmark Report
- Workout Trend Report
Plus
- View Entire History
- Dashboard Summary
- Basic Workout Summary
- Stats Report
- Comparison Report
- Workout Comparison
- Heart Rate Zones
- Heart Rate Report
- Benchmark Report
- Workout Trend Report
- Calendar Planning


