25 Jan
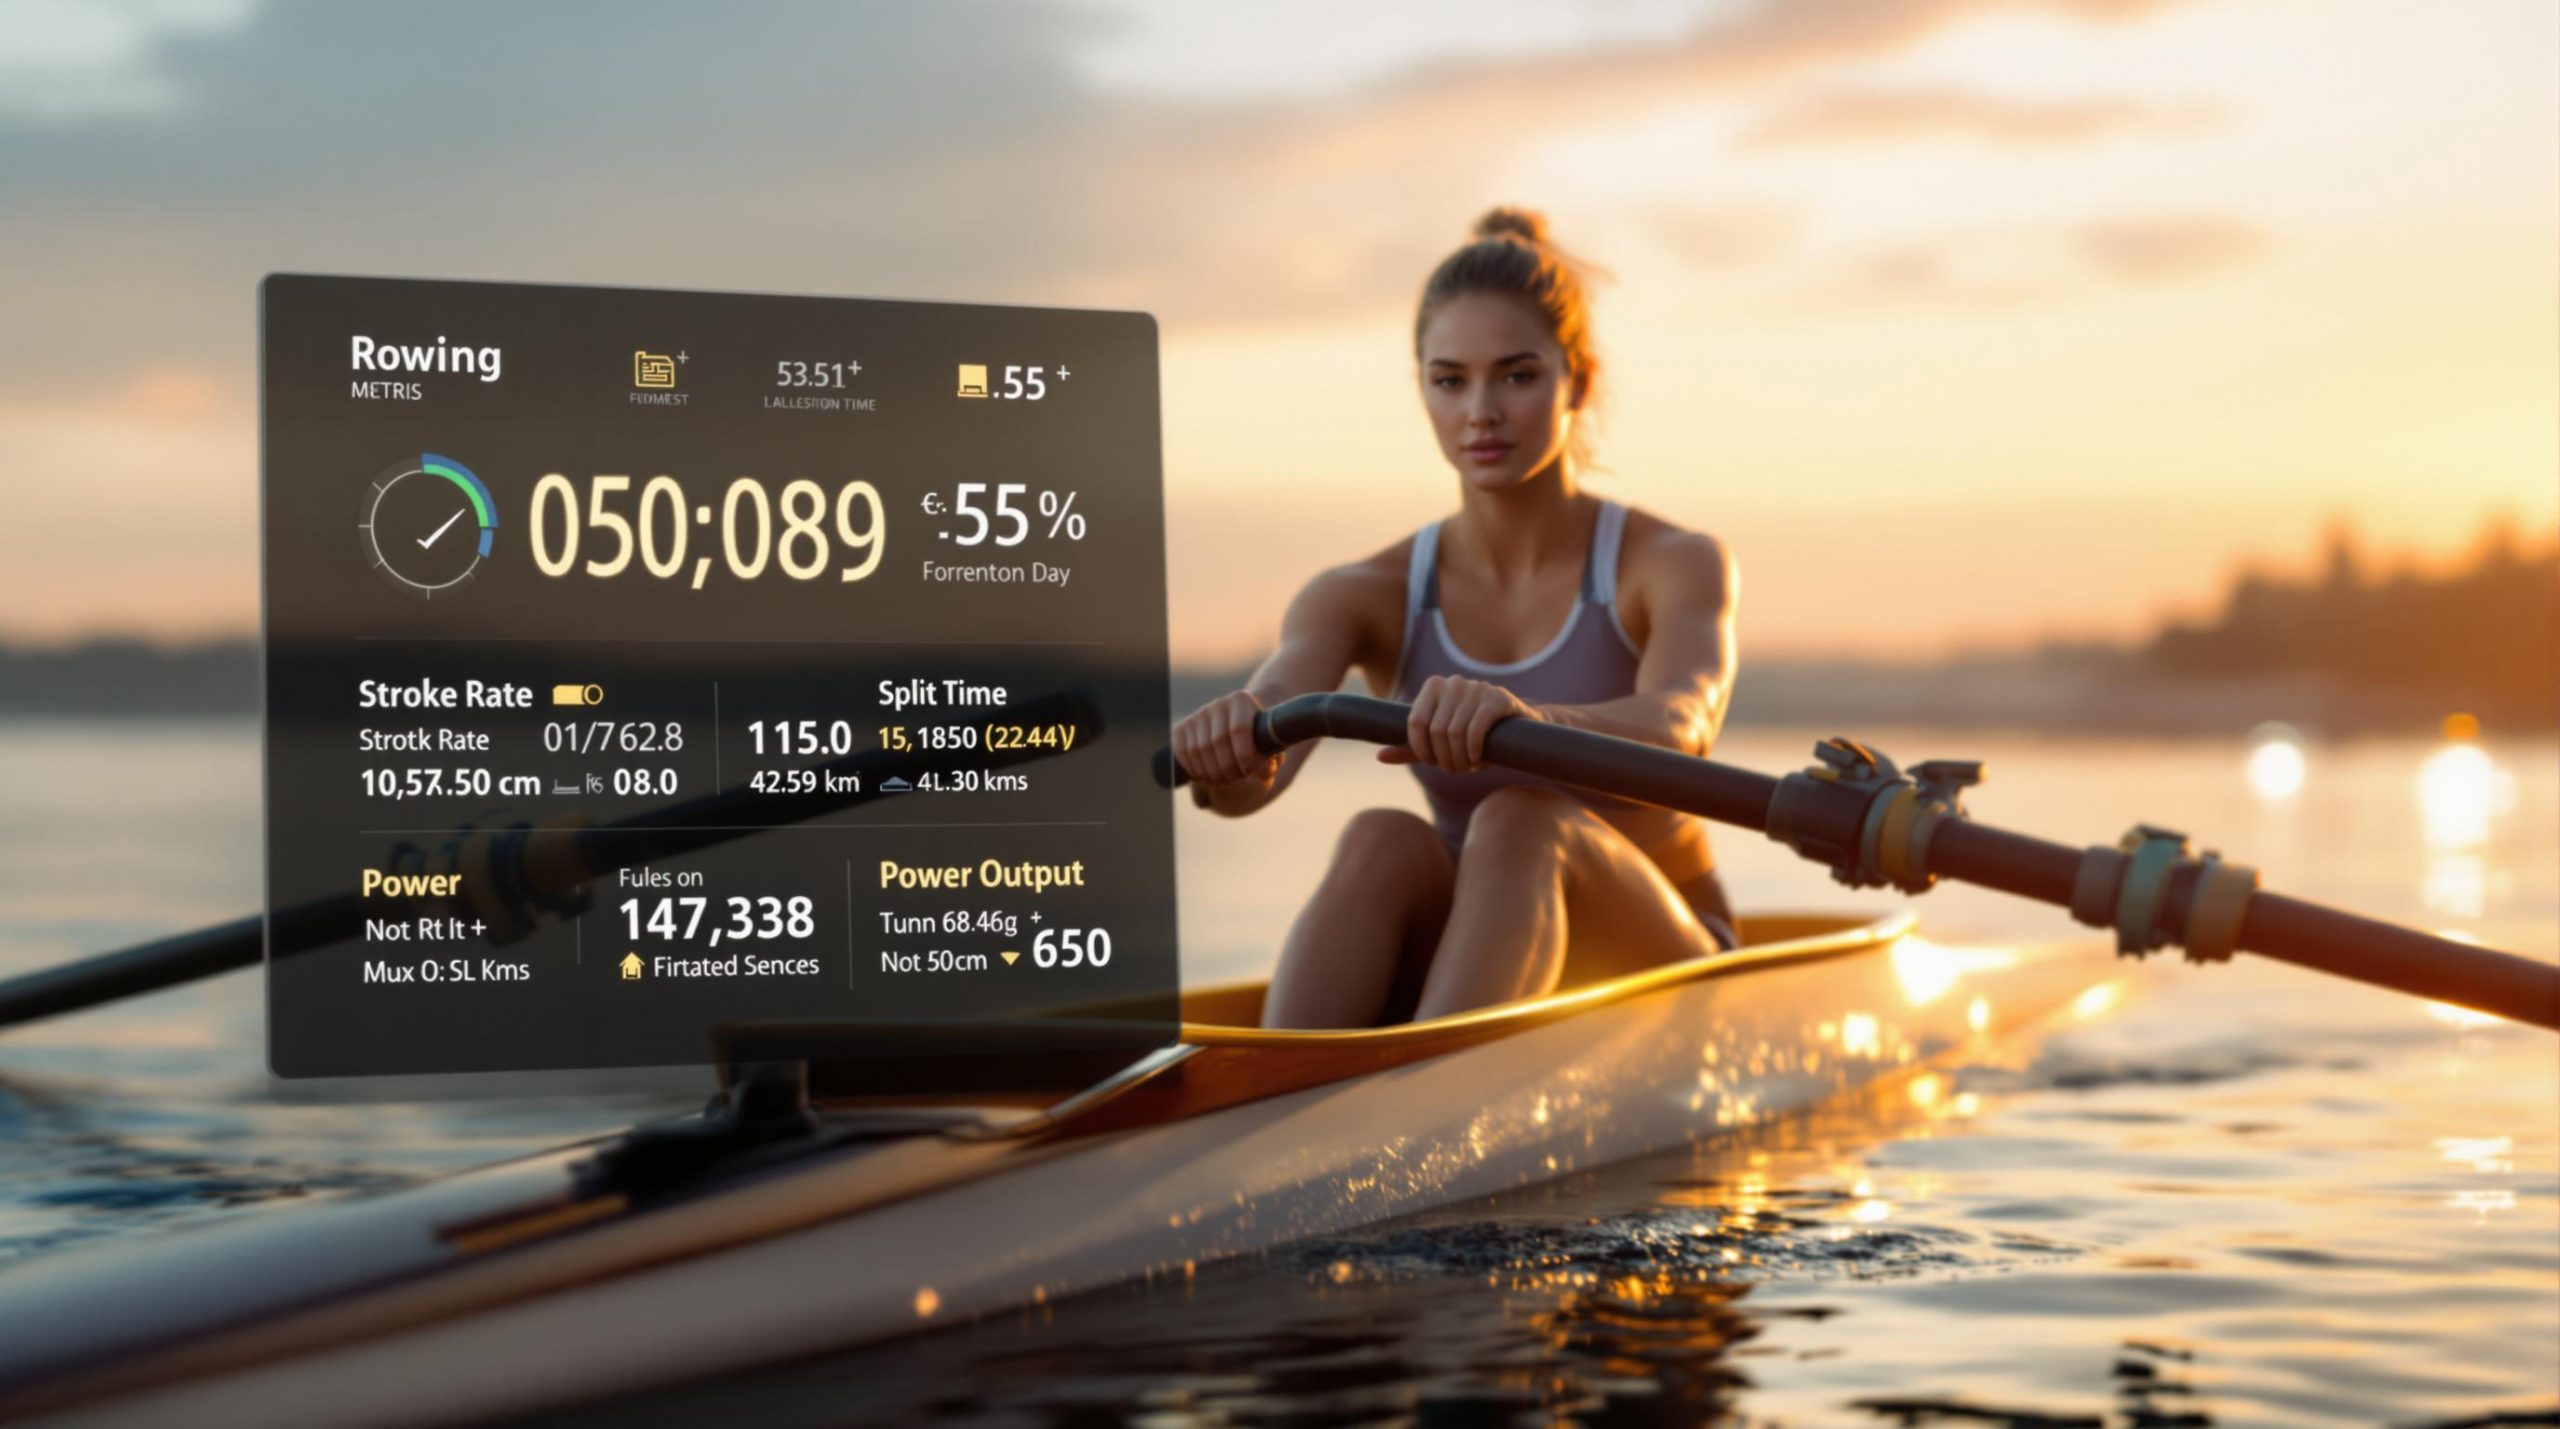
Want to improve your rowing performance? Start by understanding the key metrics: stroke rate, split time, and power output. These numbers help you analyze technique, fine-tune training, and track progress effectively.
Here’s a quick overview of what you’ll learn:
- Stroke Rate: Measures strokes per minute; balance it with power for efficiency.
- Split Time: Tracks your pace per 500m; lower split times mean faster speeds.
- Power Output: Measured in watts; reflects your strength and efficiency.
You’ll also discover how tools like Concept2, RP3, and apps like ErgMonkey and RowerUp provide actionable insights through data syncing, heart rate zone analysis, and benchmark tests. Plus, learn how to log workouts, identify technique issues, and track long-term trends for consistent improvement.
Dive into the details and start using data to row smarter, not harder.
Rowing Machine Tutorial – Stroke Rate
Key Rowing Metrics Explained
These three metrics are essential for monitoring and improving your rowing performance. Let’s break them down:
Stroke Rate: What It Means and Why It Matters
Stroke rate, measured in strokes per minute, sets the rhythm of your rowing. Balancing this rate with the power you apply is crucial for rowing effectively. This balance also ties into split time, which serves as your performance benchmark.
Split Time: Your Pace Indicator
Split time tracks how long it takes you to row 500 meters, making it a standard way to measure performance [4]. It’s a direct reflection of your speed and efficiency on the rower.
Since split time is standardized, it allows for easy comparison across various distances. While it shows your pace, it’s the power output that reveals the strength behind that pace.
Power Output: The Strength Behind the Numbers
Modern rowing machines measure power in watts, giving you instant feedback on your effort [1]. This metric is key for evaluating how efficiently you’re rowing. It can also highlight technical flaws – like a noticeable drop in power during recovery – which might signal areas that need improvement [1][5].
"Power output is a key indicator of rowing performance. Higher power output generally correlates with faster speeds and better endurance", according to performance monitoring data from Concept2 [1][2].
Analyzing Rowing Data for Improvement
Once you’ve established the key metrics, the next step is turning raw numbers into useful insights. Modern rowing machines like Concept2 and RP3 make this easier by offering detailed performance data to refine your training.
Using Concept2 and RP3 for Data Analysis
The Concept2 Performance Monitor provides real-time feedback on stroke rate and split time, while RP3’s software focuses on power output and efficiency. Both systems can sync with Rowsandall.com, giving you a centralized platform to analyze and compare your performance.
Heart Rate Data During Rowing
Tracking your heart rate helps you train smarter by staying within specific intensity zones:
- Zone 1 (50-60% max HR): Recovery
- Zone 2 (60-70%): Building base fitness
- Zone 3 (70-80%): Improving aerobic capacity
- Zone 4 (80-90%): High-intensity intervals
- Zone 5 (90-100%): Maximum effort
For the best results, focus most of your training in Zones 2 and 3. Use Zones 4 and 5 sparingly for high-intensity sessions, and reserve Zone 1 for active recovery. These zones, combined with split time targets, create a well-rounded training plan.
Identifying Technique Issues Through Data
Metrics like force curves and stroke consistency can highlight technique problems you might miss otherwise. Here’s what to watch for:
- Irregular force curves: These can indicate timing issues.
- Inconsistent stroke rates: Often a sign of rhythm problems.
- Power drop-offs during recovery: This could point to fatigue or a flaw in technique.
sbb-itb-1725142
Tracking Progress Over Time
To turn data into meaningful progress, focus on monitoring three key areas:
Logging Workouts Effectively
Consistent and detailed workout logging is the foundation of tracking progress. Here’s what to include:
- Key metrics like time, distance, pace, watts, calories, stroke rate, and heart rate
- Environmental factors such as time of day and energy levels
- Details of both steady-state and interval workouts
- Notes on technique adjustments made during sessions
- Recovery quality and perceived exertion levels
Tools like RowPro provide stroke-by-stroke recording, capturing all essential metrics. If you prefer exporting data, BoatCoach allows you to transfer workout logs to Excel for further analysis.
Using Benchmark Tests
Benchmark tests offer measurable data to assess your improvement over time. These standardized tests focus on foundational metrics like split time and power output:
| Test Type | Distance/Time | Key Metrics |
|---|---|---|
| Sprint Test | 500m | Peak power, max stroke rate |
| Standard Test | 2000m | Split time, average power |
| Endurance Test | 5000m | Sustained power, efficiency |
| Power Test | 1 minute | Maximum watts, recovery patterns |
Regularly incorporating these tests into your routine helps track performance gains and identify areas for improvement.
Analyzing Long-Term Data Trends
Analyzing long-term trends is where the big picture comes into focus. ErgMonkey’s Standard plan ($39.99/year) offers tools for diving deep into performance data, including:
- Heart rate zone analysis across sessions
- Detailed workout comparison reports
- Benchmark tracking to monitor progress over time
Key areas to evaluate include:
- Split Time Improvements: Look for better average split times in similar workouts.
- Power Output Growth: Track increases in sustained power during benchmark tests.
- Stroke Efficiency: Examine the relationship between stroke rate and power output.
- Recovery Trends: Assess heart rate recovery improvements between intervals.
Using Technology for Data Insights
Technology takes raw metrics and turns them into meaningful insights through advanced tools and systems. This goes beyond simply interpreting data – it’s about making it actionable.
Rowing Apps and Software for Analytics
Apps and software designed for rowing can add depth to the metrics provided by devices like Concept2 and RP3. Here are some popular platforms and what they bring to the table:
| Platform | Key Features |
|---|---|
| ErgData | Real-time tracking, daily workout suggestions, Strava sync |
| RowerUp | Stroke angle analysis, body positioning feedback, technique insights |
| ErgMonkey | Heart rate zone tracking, workout comparisons |
| Rowsandall | Force curve analysis, in-stroke performance breakdown |
Syncing Data Across Devices
To create a smooth training experience, syncing your devices is key. Here’s how you can streamline your setup:
- Connect your rowing machine to a primary app, like ErgData for Concept2.
- Enable cloud syncing with analysis platforms to store and review your data.
- Pair heart rate monitors or wearables with your tracking system for a complete picture.
This integration minimizes manual data entry and ensures accurate tracking. Plus, it opens the door to advanced tools like ErgMonkey for deeper analysis.
ErgMonkey‘s Role in Data Analysis
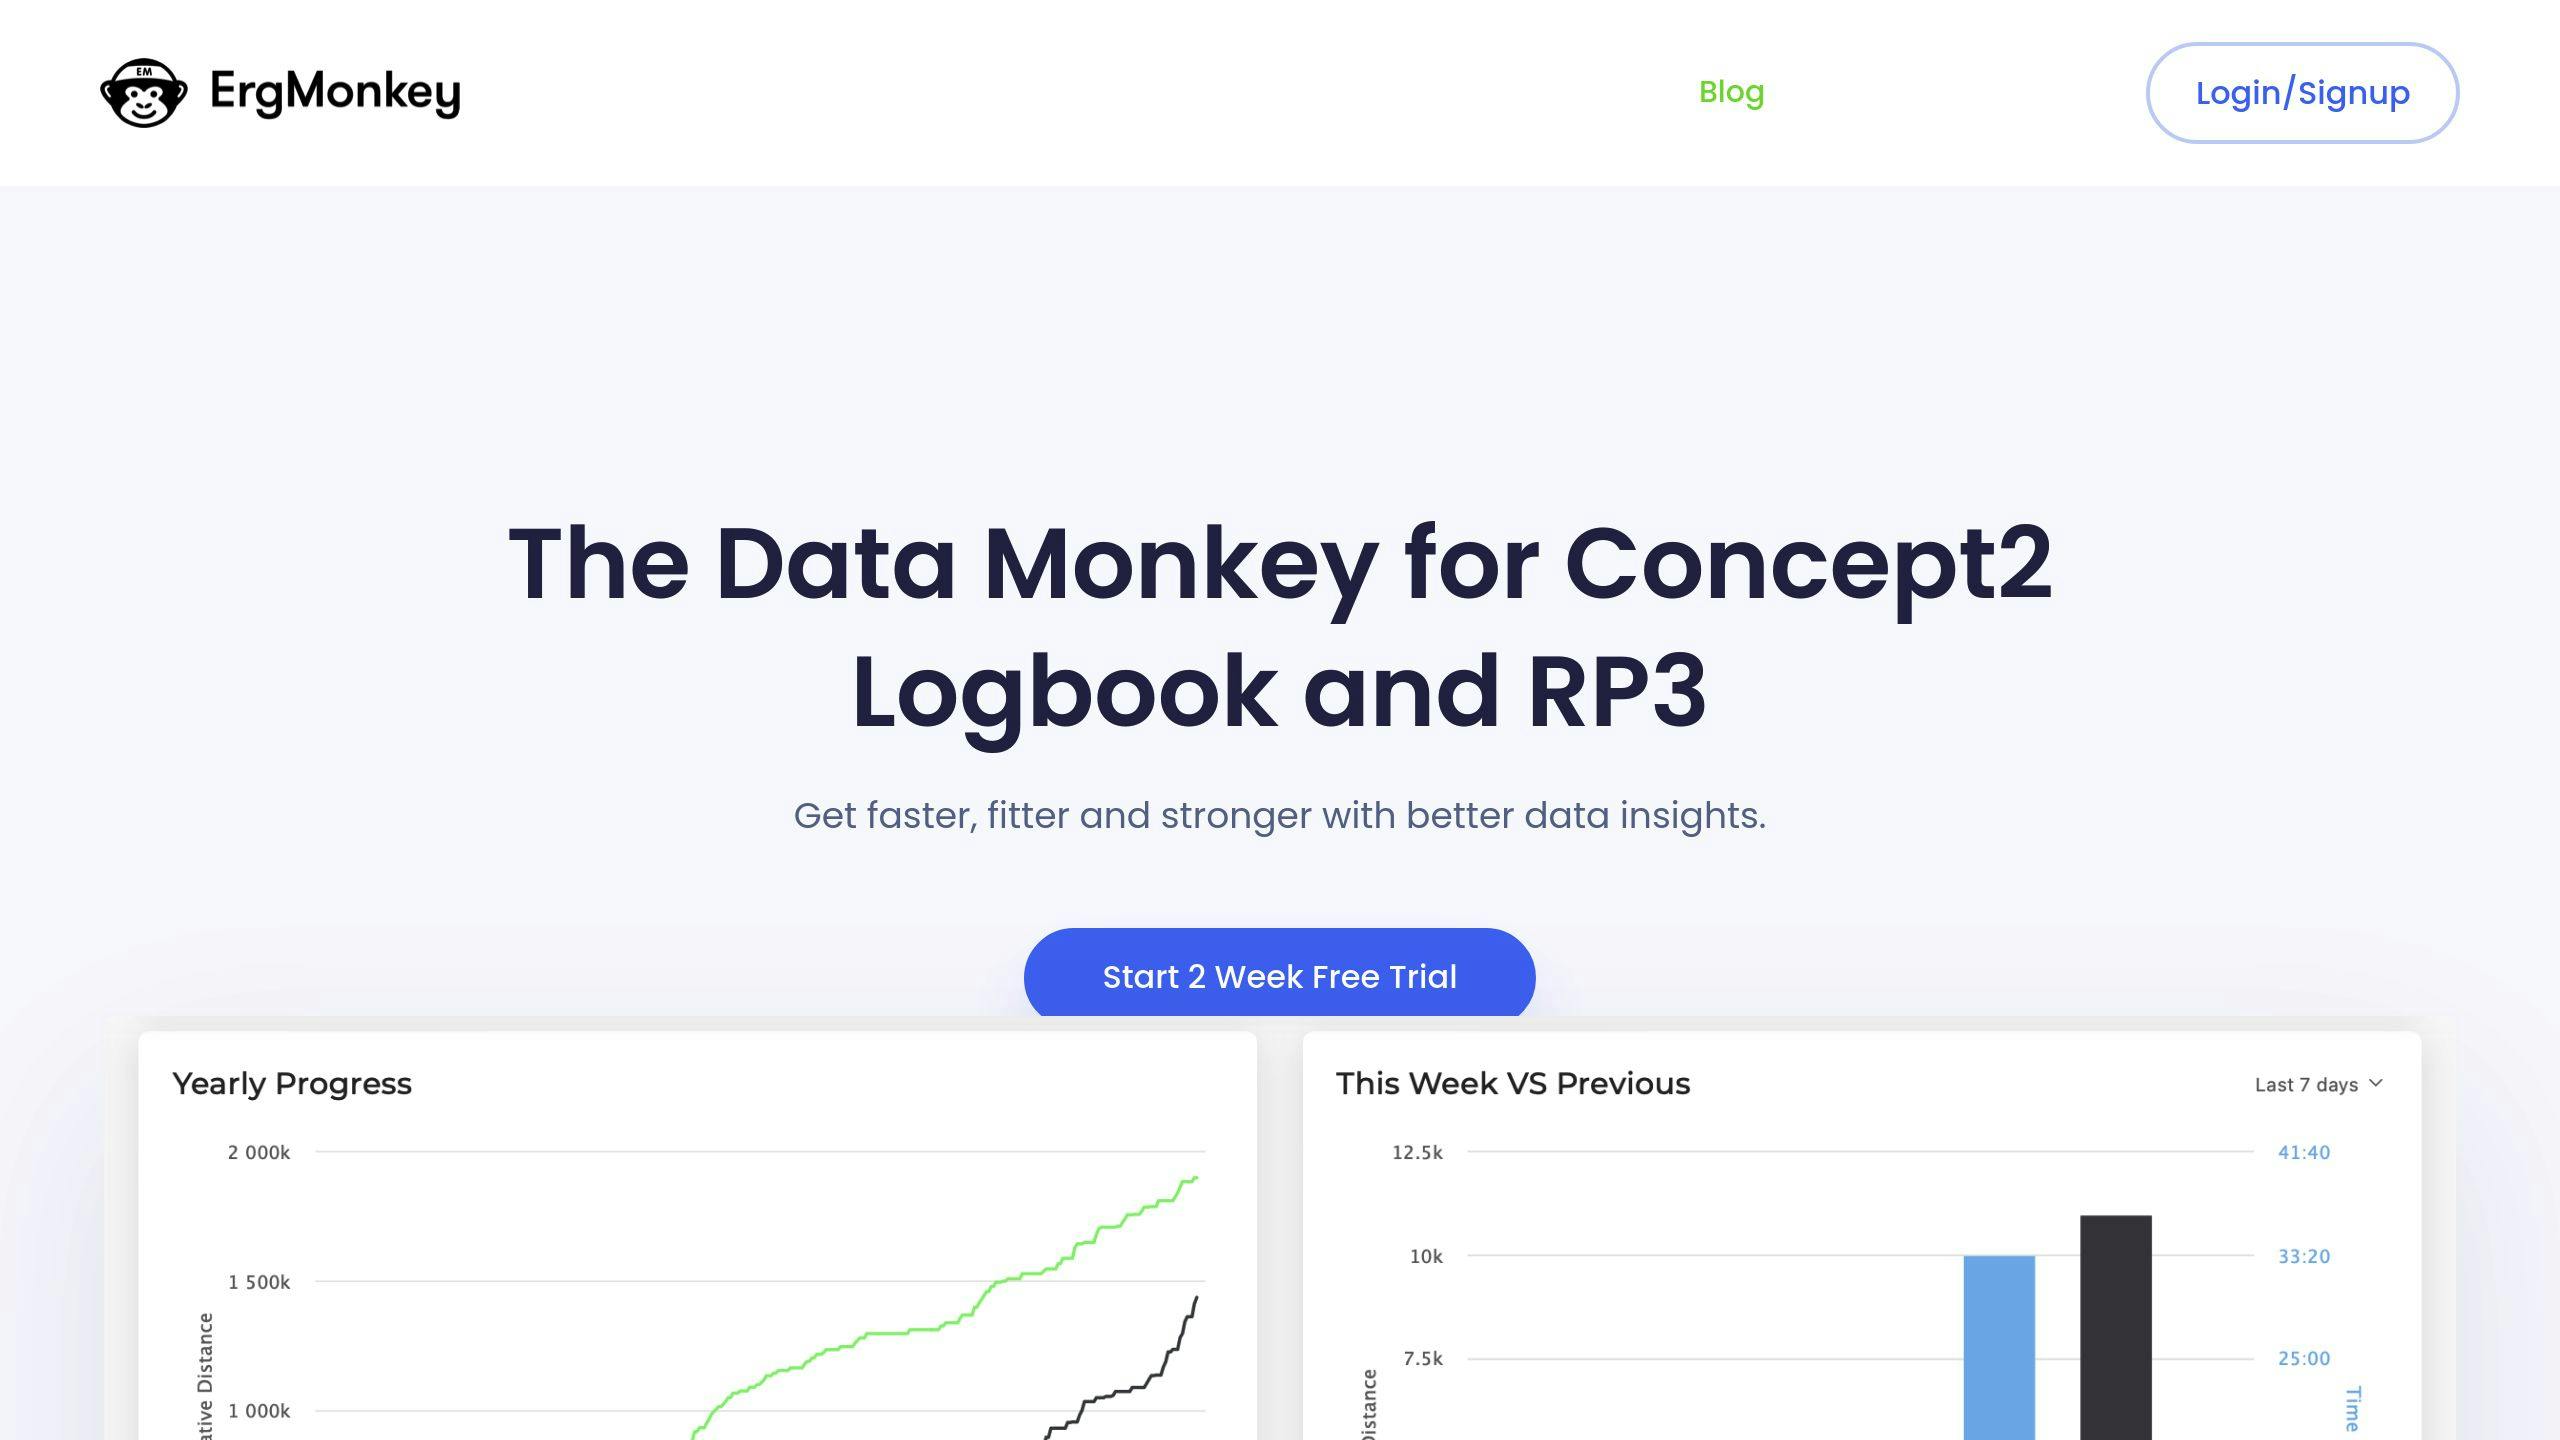
ErgMonkey takes the data from Concept2 and RP3 and brings it to life with features like workout visualizations, detailed comparison reports, and interactive performance graphs. By combining data from multiple training tools, it helps uncover patterns and trends that might otherwise go unnoticed. This makes it an essential tool for rowers looking to refine their performance.
Conclusion and Key Points
Using these analytical strategies effectively allows rowers to improve their performance through consistent measurement and data-driven insights.
Focusing on metrics like stroke rate, split time, and power output provides a solid framework for analyzing performance. Tools such as RowerUp’s real-time form feedback and Quiske‘s stroke dynamics measurements add another layer of precision, enabling targeted technical improvements [2][3].
Data analysis plays a critical role in identifying technique flaws and monitoring progress. For example, RowerUp’s system offers immediate feedback during training, helping athletes correct form issues on the spot. It also provides post-session analysis for ongoing refinement [3]. Similarly, Quiske’s rowing pods deliver detailed stroke data, whether on ergometers or water, giving rowers actionable insights for improving their technique [2].
Here’s what metrics-focused training can bring to the table:
- Real-time form corrections to fine-tune technique during sessions
- Benchmark testing to track progress and identify trends over time
- Detailed stroke efficiency data for better technical understanding
- Seamless data syncing across devices for a unified view of performance
To get the most out of these tools, rowers should prioritize consistent workout logging, conduct regular benchmark tests, and review their performance data systematically. This combination of reliable tracking and structured analysis lays the groundwork for steady improvement.
Platforms like ErgMonkey help by integrating workout data, uncovering patterns, and turning insights into actionable training adjustments that boost performance.
Ultimately, effective data analysis depends on having the right tools and knowing how to interpret the results. Regular reviews of key metrics, paired with benchmark testing, provide a clear path to achieving long-term performance goals.
FAQs
What does split cal mean on a rowing machine?
Split cal refers to the number of calories you burn per hour while rowing. Though it’s less common than split time, this metric is great for aligning your calorie-burning goals with your training. It works alongside split time and watts to give you a full picture of your energy output. For more on split time, check out the ‘Split Time: Understanding Performance’ section.
How do I interpret my split time?
Split time reflects your pace over 500 meters. For instance, a 2:00 split means you’re rowing at a speed that would cover 500 meters in 2 minutes. The lower your split time, the faster your rowing speed. This metric ties directly to the performance benchmarks discussed earlier.
What’s the optimal stroke rate for different skill levels?
Stroke rate depends on your experience level:
- Beginners: Aim for 20-24 strokes per minute (spm)
- Advanced rowers: Stick to 26-30 spm
- Elite athletes: Often maintain even higher rates during intense sessions
How can I use heart rate data effectively?
Tools like ErgMonkey can analyze your heart rate zones to monitor how your cardiovascular system responds during workouts. This helps you train at the right intensity to hit your goals. You can find more about heart rate strategies in ‘Analyzing Rowing Data for Improvement.’
What rowing apps provide the best data analysis?
Some of the top options include:
- Concept2’s Performance Monitor for basic metrics
- RP3 for detailed stroke analysis
- RowerUp for form feedback
- ErgMonkey for advanced data integration
How do I track long-term progress?
Use benchmark tests, workout logs, and power output trends to monitor your progress. Tools like ErgMonkey’s Workout Trend Report can help you spot patterns and tweak your training. Their Standard plan also offers comparison reports and features for tracking benchmarks.