14 Jan

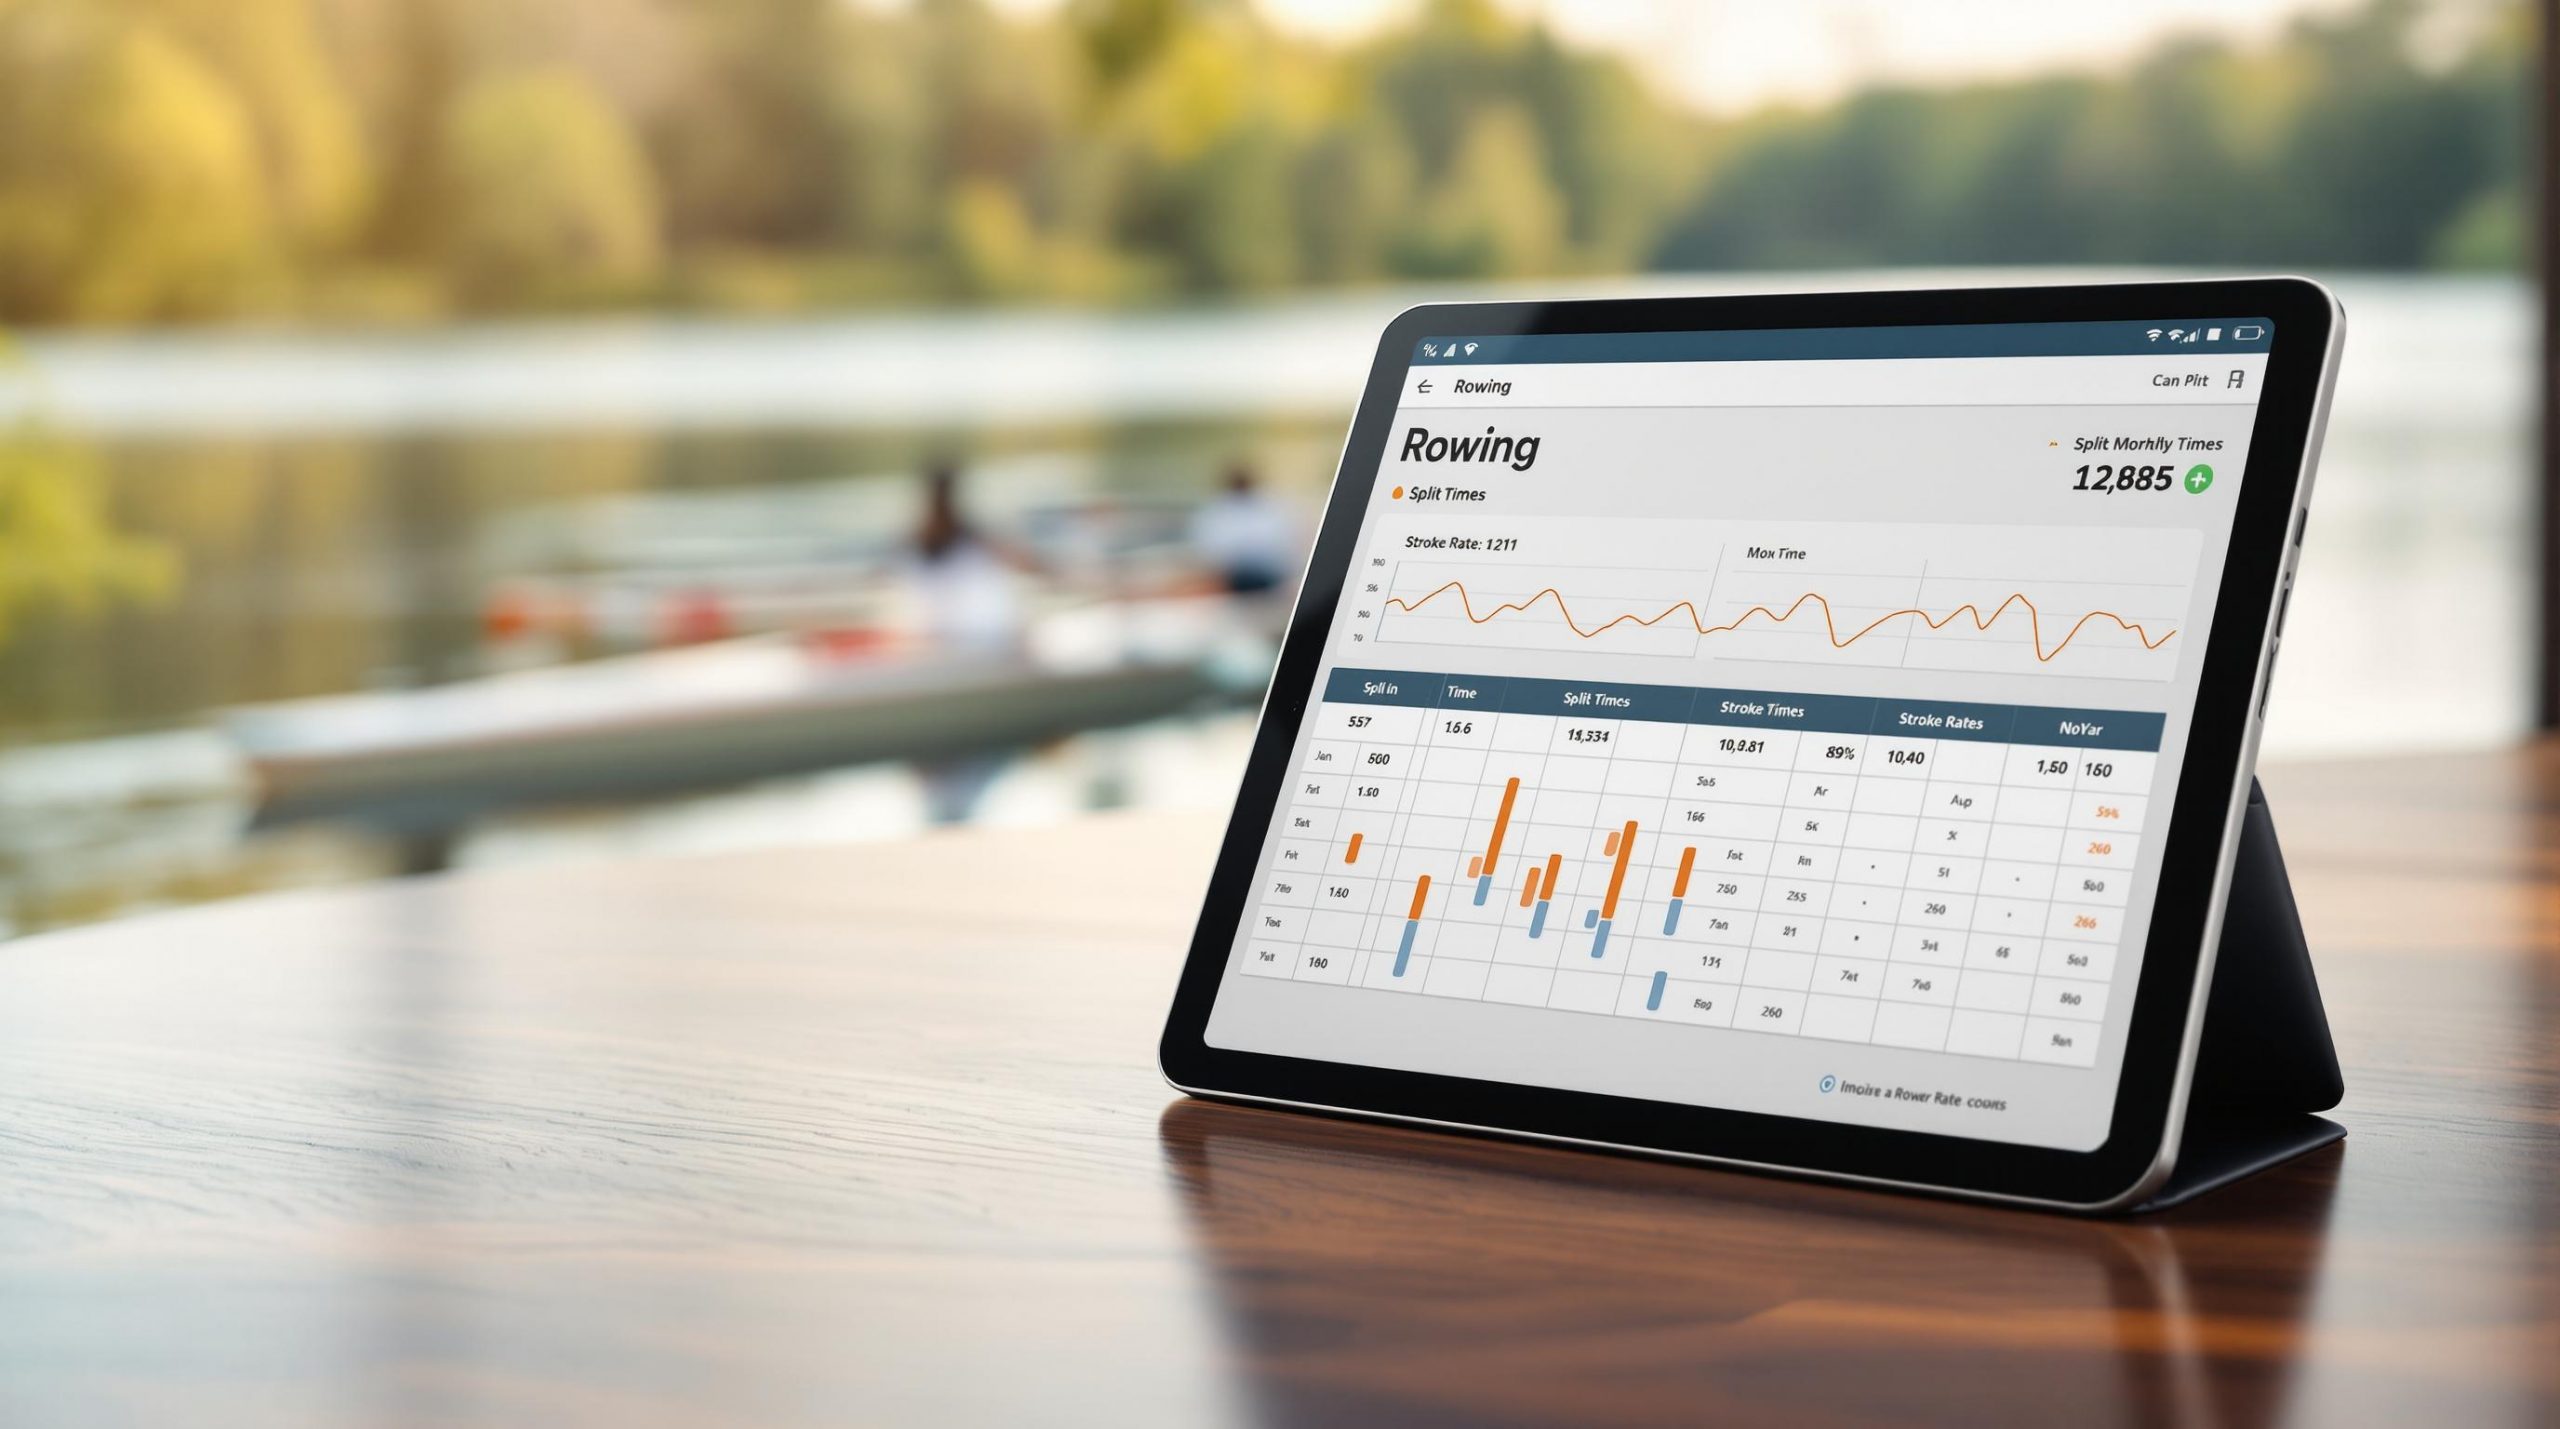
Want to improve your rowing performance? Start by understanding your data. Rowing performance charts break down metrics like split times, stroke rates, and power output to help you track progress, refine technique, and achieve your goals. Here’s what you’ll learn:
- Split Times: Measure speed over 500m (lower is faster).
- Stroke Rate: Tracks strokes per minute for rhythm and intensity.
- Power Output: Shows energy generated in watts for strength and efficiency.
Tools like the Concept2 Logbook and advanced platforms like ErgMonkey make tracking easier, offering insights into trends, technique, and fitness. Use this guide to interpret charts, avoid common mistakes, and set actionable goals for steady improvement.
Understanding the Concept 2 Rowing Machine Monitor
Understanding Key Rowing Metrics
Split times, stroke rates, and power output are essential for analyzing rowing performance. Let’s break down each metric to help you interpret your performance data effectively.
Split Times Explained
Split time measures your rowing speed and efficiency over 500 meters. For beginners, split times usually fall between 2:30 to 3:00 per 500 meters, while experienced rowers aim for 2:00 or less. The lower your split, the faster you’re rowing. A higher split means you’re moving at a slower pace.
While split times focus on speed, stroke rates give insight into the rhythm of your rowing.
Understanding Stroke Rates
Stroke rate, measured in strokes per minute (SPM), reflects your rowing rhythm and intensity. Recreational rowers often maintain a rate of 20-28 SPM, while competitive rowers can reach 30-36 SPM during intense sessions. Stroke rates also vary based on the workout:
- 20-24 SPM: Warm-ups and recovery
- 24-26 SPM: Steady-state endurance
- 28-36 SPM: Race pace or high-intensity efforts
"Think of Stroke Rate as a Tool, not a Goal." – Author Unknown
Now, let’s look at power output, which ties strength and efficiency to each stroke.
Power Output as a Metric
Power output, measured in watts, shows the energy you generate with each stroke. This metric highlights your rowing strength and efficiency. Beginners might produce 100-150 watts during steady-state rowing, while competitive rowers often exceed 250 watts during intense efforts.
To boost your power output, focus on these key techniques:
- Drive with your legs to maximize force.
- Engage your core for stability and control.
- Refine stroke transitions for smoother, more efficient movements.
How to Read and Interpret Performance Charts
Understanding Chart Layout
The Concept2 Performance Monitor (PM5) presents essential metrics, with time or distance shown on the horizontal axis and performance metrics on the vertical axis. Split time takes center stage, while stroke rate and heart rate are displayed in smaller fields for additional context.
The force curve graph is particularly useful for evaluating technique. A smooth, bell-shaped curve signals efficient power application during your stroke, while uneven or jagged shapes highlight areas that might need attention.
Spotting Patterns and Trends
When reviewing your rowing data, focus on uncovering consistent patterns across multiple sessions. Key areas to examine include:
- Performance Stability: Check if your split times remain steady within a 2-3 second range, which reflects good pacing control. Also, review the force curve to ensure power is being applied smoothly and continuously.
- Heart Rate Response: Observe how your heart rate changes with varying workout intensities to better understand your fitness levels and endurance.
However, while spotting patterns is important, it’s just as crucial to avoid errors that could lead to inaccurate conclusions.
Common Errors in Chart Interpretation
To get the most out of your performance charts, steer clear of these frequent mistakes:
- Focusing on a Single Metric: Paying too much attention to one metric, like split time, without considering others that provide a fuller picture of your performance.
- Misinterpreting Trends: Making assumptions based on limited data or comparing workouts that differ in structure or goals.
Think of performance charts as tools to refine your technique and efficiency, not just a record of past sessions. Use them to pinpoint areas where you can improve and make smarter adjustments to your training.
sbb-itb-1725142
Using Performance Data to Improve Rowing
Performance data acts as a guide to help you set goals, monitor progress, and fine-tune your rowing technique.
Setting Goals You Can Reach
Set goals that match your current abilities and break them into smaller, achievable steps. The Concept2 Logbook is a great tool for this – it tracks both lifetime and seasonal meters, helping you balance short-term achievements with long-term progress. This approach ensures you can push yourself while still allowing time for recovery, leading to steady growth.
Monitoring Your Progress
Keep an eye on how you’re doing with easy-to-use tools. The Concept2 Logbook lets you track meters rowed, compare your stats with others worldwide, and participate in challenges to stay motivated. When reviewing your performance, take a close look at your heart rate during steady-state rows. A flat heart rate graph during consistent effort shows you’re improving your cardiovascular fitness and pacing skills.
By identifying patterns in your performance data, you can start making adjustments to your technique.
Refining Your Technique with Metrics
Performance data can pinpoint areas where your rowing technique can get better. Focus on these key metrics:
- Heart Rate Consistency: A steady heart rate during long, even-paced rows signals good pacing and technique. Sudden changes might reveal areas to work on.
- Power Delivery: A smooth and balanced force curve shows efficient power application. Uneven patterns suggest opportunities to adjust your technique.
Advanced tools like ErgMonkey provide detailed analysis of split times and power curves, helping you zero in on specific adjustments that can improve your performance. These insights make it easier to refine your rowing for better results.
Advanced Tools for Rowing Performance Analysis
Using advanced analytics tools can give you a much deeper understanding of your rowing performance, helping you make smarter training choices.
ErgMonkey: Performance Analysis Made Easy

ErgMonkey is an analytics platform designed to work effortlessly with both Concept2 and RP3 rowing machines. It helps you track long-term trends and make informed decisions by offering interactive visualizations and detailed workout comparisons.
Here are some standout features:
- Interactive performance graphs for easy data interpretation
- Progress tracking to monitor improvements over time
- Power phase analysis for a closer look at technique and efficiency
ErgMonkey Plans: Which One Fits Your Needs?
ErgMonkey offers three subscription options tailored to different training goals:
| Plan Feature | Lite | Standard | Plus |
|---|---|---|---|
| Annual Cost | $19.99 | $39.99 | $49.99 |
| History Access | 365 days | Unlimited | Unlimited |
| Basic Analytics | ✓ | ✓ | ✓ |
| Heart Rate Analysis | – | ✓ | ✓ |
| Workout Comparison | – | ✓ | ✓ |
| Calendar Planning | – | – | ✓ |
The Standard plan is a great middle-ground, offering features like heart rate analysis and workout comparisons without a steep price tag – perfect for those just starting out.
While there are other tools available, ErgMonkey stands out for its smooth integration with Concept2 machines, ensuring accurate and consistent data. Adding tools like ErgMonkey to your training routine can help you gain clearer insights and refine your performance with precision.
Conclusion and Next Steps
Key Takeaways
Tracking rowing performance data plays a big role in refining your technique and achieving better outcomes. In this guide, we covered essential metrics such as split times, stroke rates, and power output – key elements for monitoring your progress. By combining these basic metrics with more in-depth analytics, you can make smarter decisions about your training.
Now that you’re familiar with these metrics and tools, let’s outline some practical steps to start analyzing your performance.
Beginner’s Action Plan
Here’s a simple plan to help you dive into rowing performance analysis:
| Weeks | Focus Area | Action Steps |
|---|---|---|
| 1-2 | Basic Tracking | Record split times and stroke rates |
| 3-4 | Data Analysis | Start using the Concept2 Logbook |
| 5-6 | Advanced Metrics | Add heart rate monitoring to your routine |
The Concept2 Logbook is a highly effective tool for tracking progress and engaging in challenges. Pairing it with the ErgData app and PM5 monitor enhances your insights by including heart rate data [1]. This makes it easier to spot trends in your performance.
After mastering the basics, consider tools like ErgMonkey for a deeper dive into your data. By following this step-by-step approach, you’ll establish a solid foundation for performance tracking and gradually move into more advanced analysis techniques.

