18 Jan

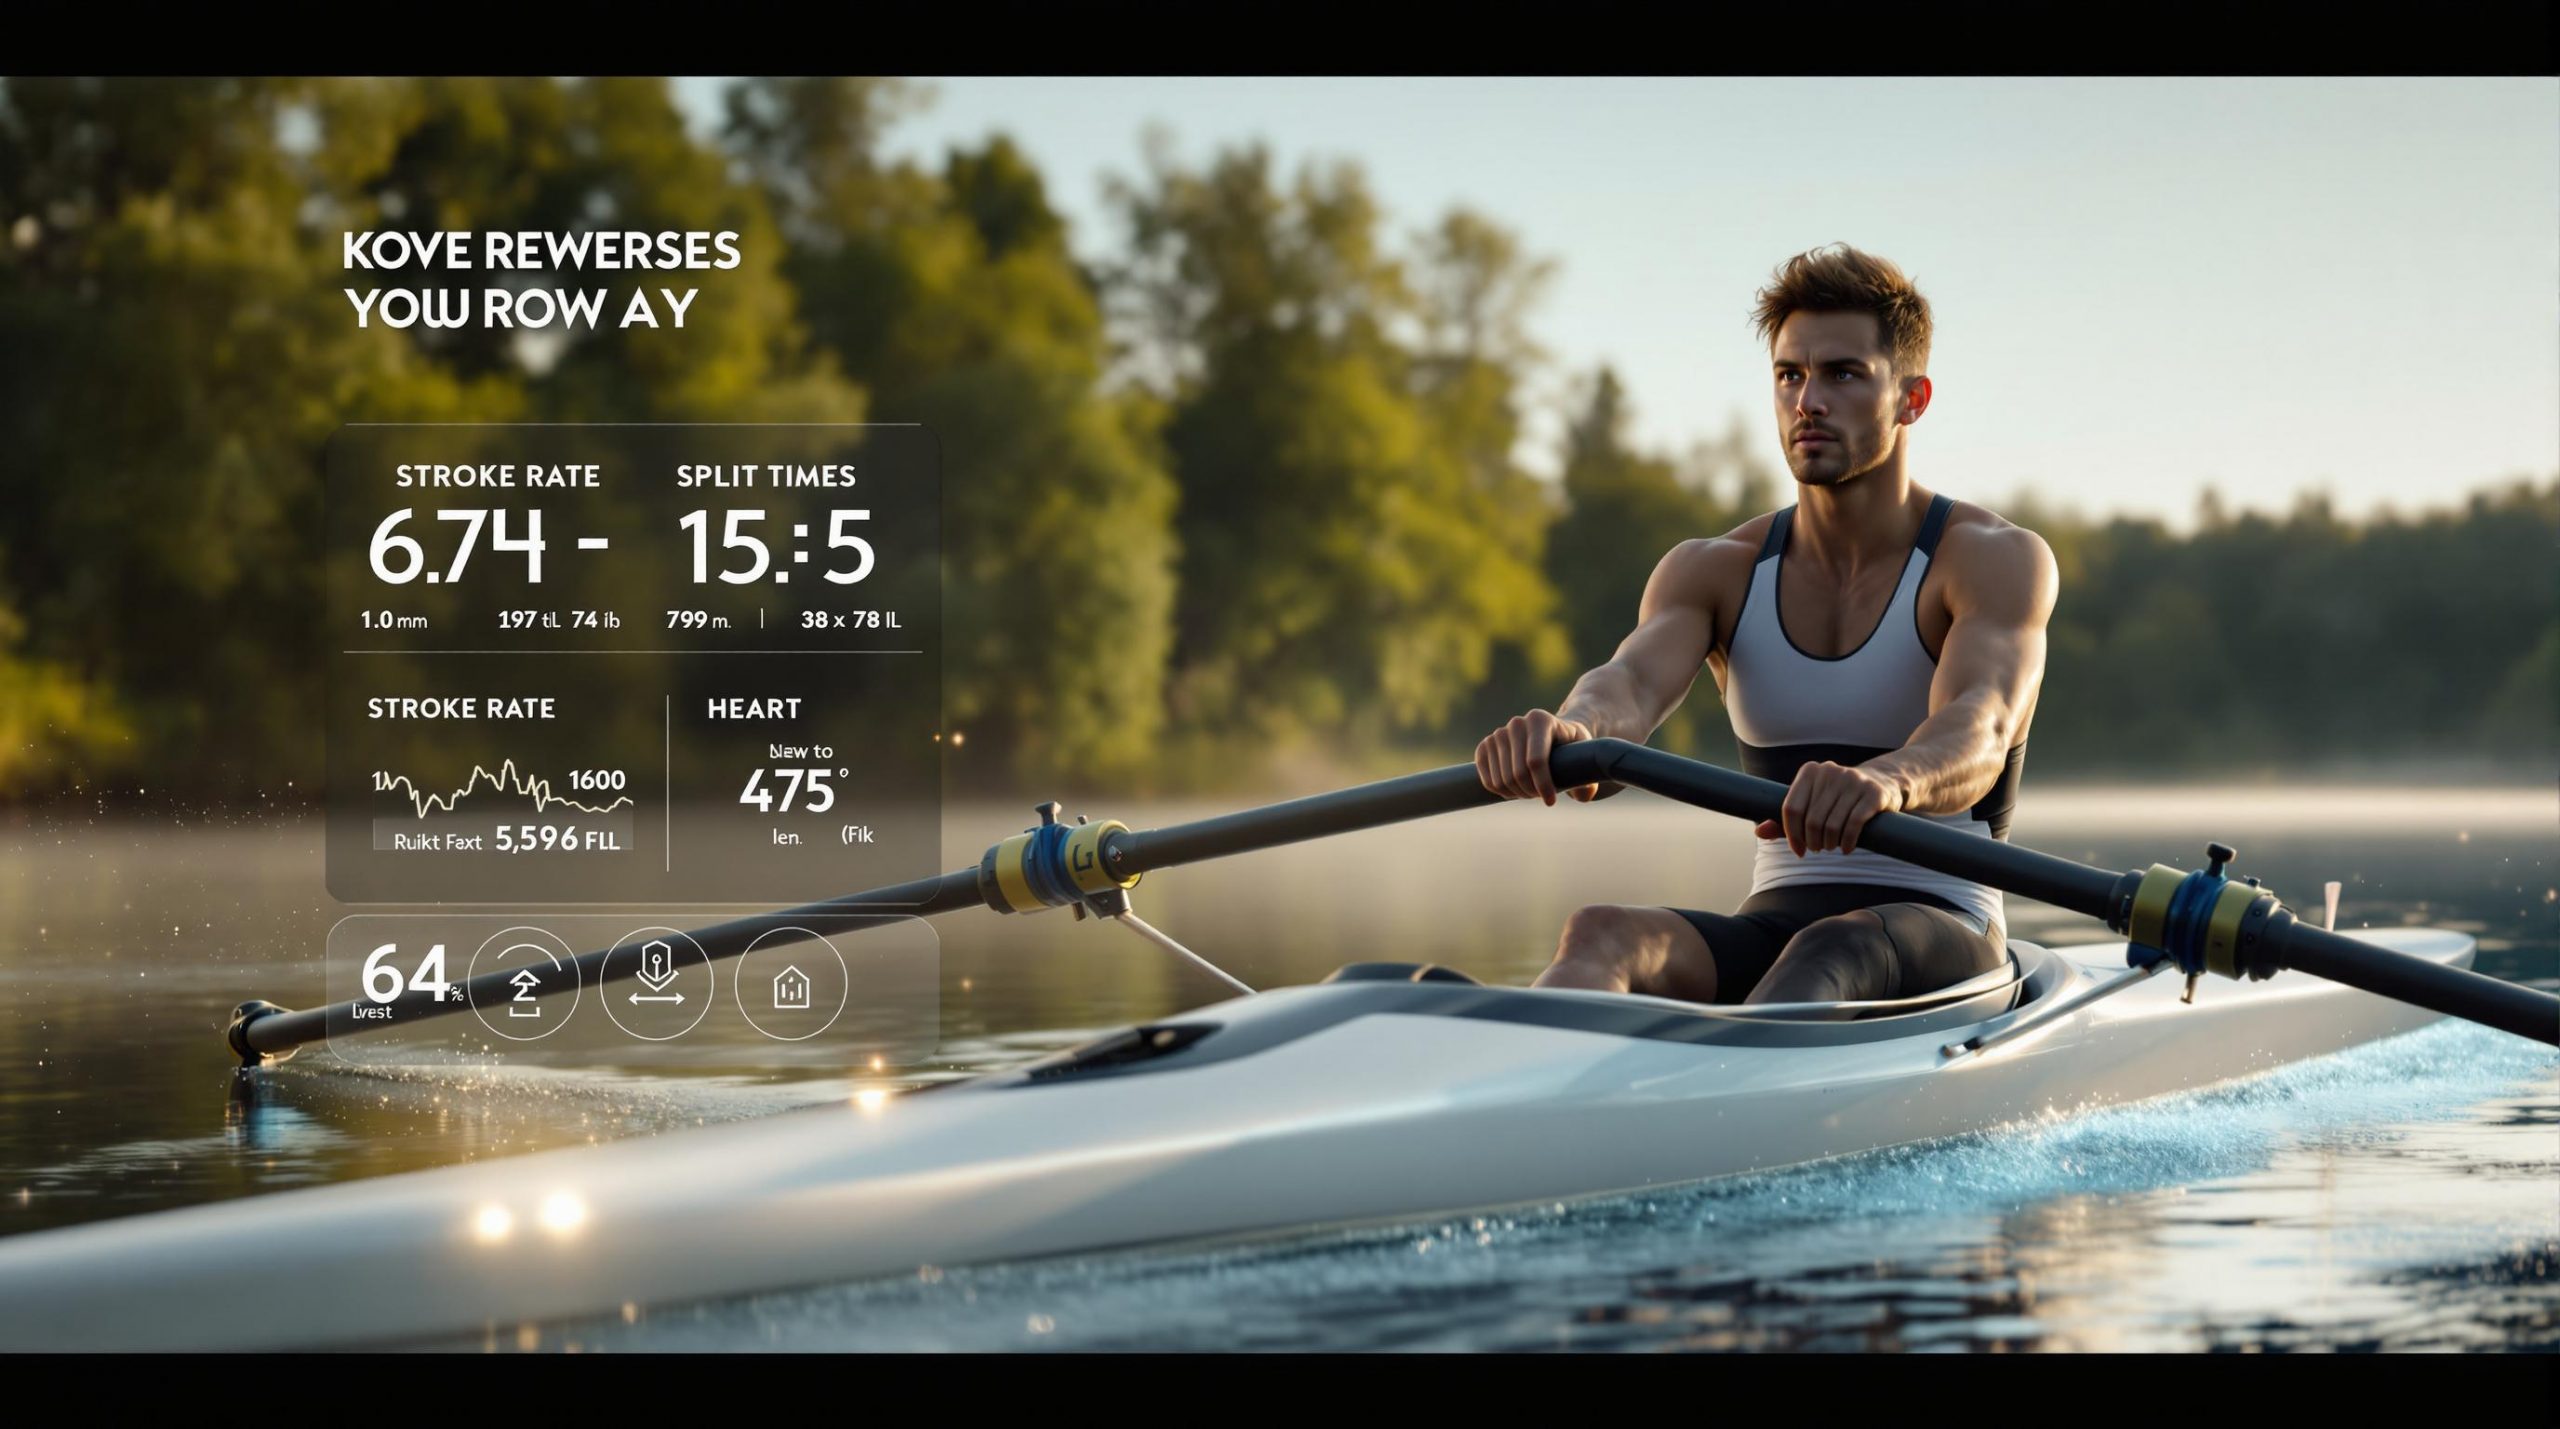
Monitoring your rowing progress is essential for better results. Focus on these key areas:
- Stroke Rate (SPM): Keep 18-22 SPM for endurance and 28-32 SPM for sprints.
- Split Times: Adjust splits based on workout goals (e.g., race pace, endurance).
- Distance: Track total meters rowed to measure endurance and volume.
- Heart Rate Zones: Stay in target zones for safer, more effective training.
- Recovery: Balance training with rest to avoid overtraining.
Use tools like Concept2 Logbook, RP3 Platform, or ErgMonkey to automate tracking and analyze trends. Review your data monthly to adjust your plan, improve steadily, and prevent injury.
Let’s dive deeper into how you can track and use these metrics effectively.
Related video from YouTube
Key Metrics to Monitor for Better Rowing Performance
Tracking the right metrics is crucial for improving your rowing performance. Here’s a breakdown of the most important data points to focus on during your training.
Stroke Rate Basics
Stroke rate, or strokes per minute (SPM), plays a big role in both efficiency and endurance. For steady-state workouts, aim for 18-22 SPM to build endurance. For sprint intervals, push up to 28-32 SPM to maximize power. Tools like Concept2 can help you maintain consistent intensity without losing proper form.
Split Times and What They Tell You
Split times, which measure your time per 500 meters, are key indicators of speed and efficiency. Use these guidelines for different training goals:
- Endurance: Add 10-15 seconds to your race pace split.
- Tempo Workouts: Add 5-7 seconds to your race pace split.
- Race Pace: Stick to your target split.
- Sprints: Subtract 2-5 seconds from your race pace split.
Platforms like the Concept2 Logbook allow you to track your pacing and ensure consistency.
Logging Distance Covered
Tracking the total meters rowed helps you monitor endurance and training volume. Tools like RP3 and the Concept2 Logbook make it easy to log your distances, track weekly progress, and even participate in challenges like the Concept2 Million Meter Club.
Monitoring Heart Rate Zones
Heart rate data helps you match your training intensity to your specific goals. Whether you’re focusing on endurance, recovery, or high-intensity intervals, monitoring your heart rate alongside metrics like stroke rate and split times gives you a clearer picture of your overall performance and cardiovascular fitness.
Tracking Progress Over Time
Analyzing your performance over time reveals trends, highlights progress, and identifies areas to improve. Software like RowPro and the Concept2 Logbook can help you compare split times, stroke efficiency, heart rate data, and distance progression across sessions.
sbb-itb-1725142
Best Tools for Tracking Rowing Metrics
Using the right tools can make a big difference in how you monitor and improve your rowing performance. Here’s a breakdown of some top platforms you might want to consider.
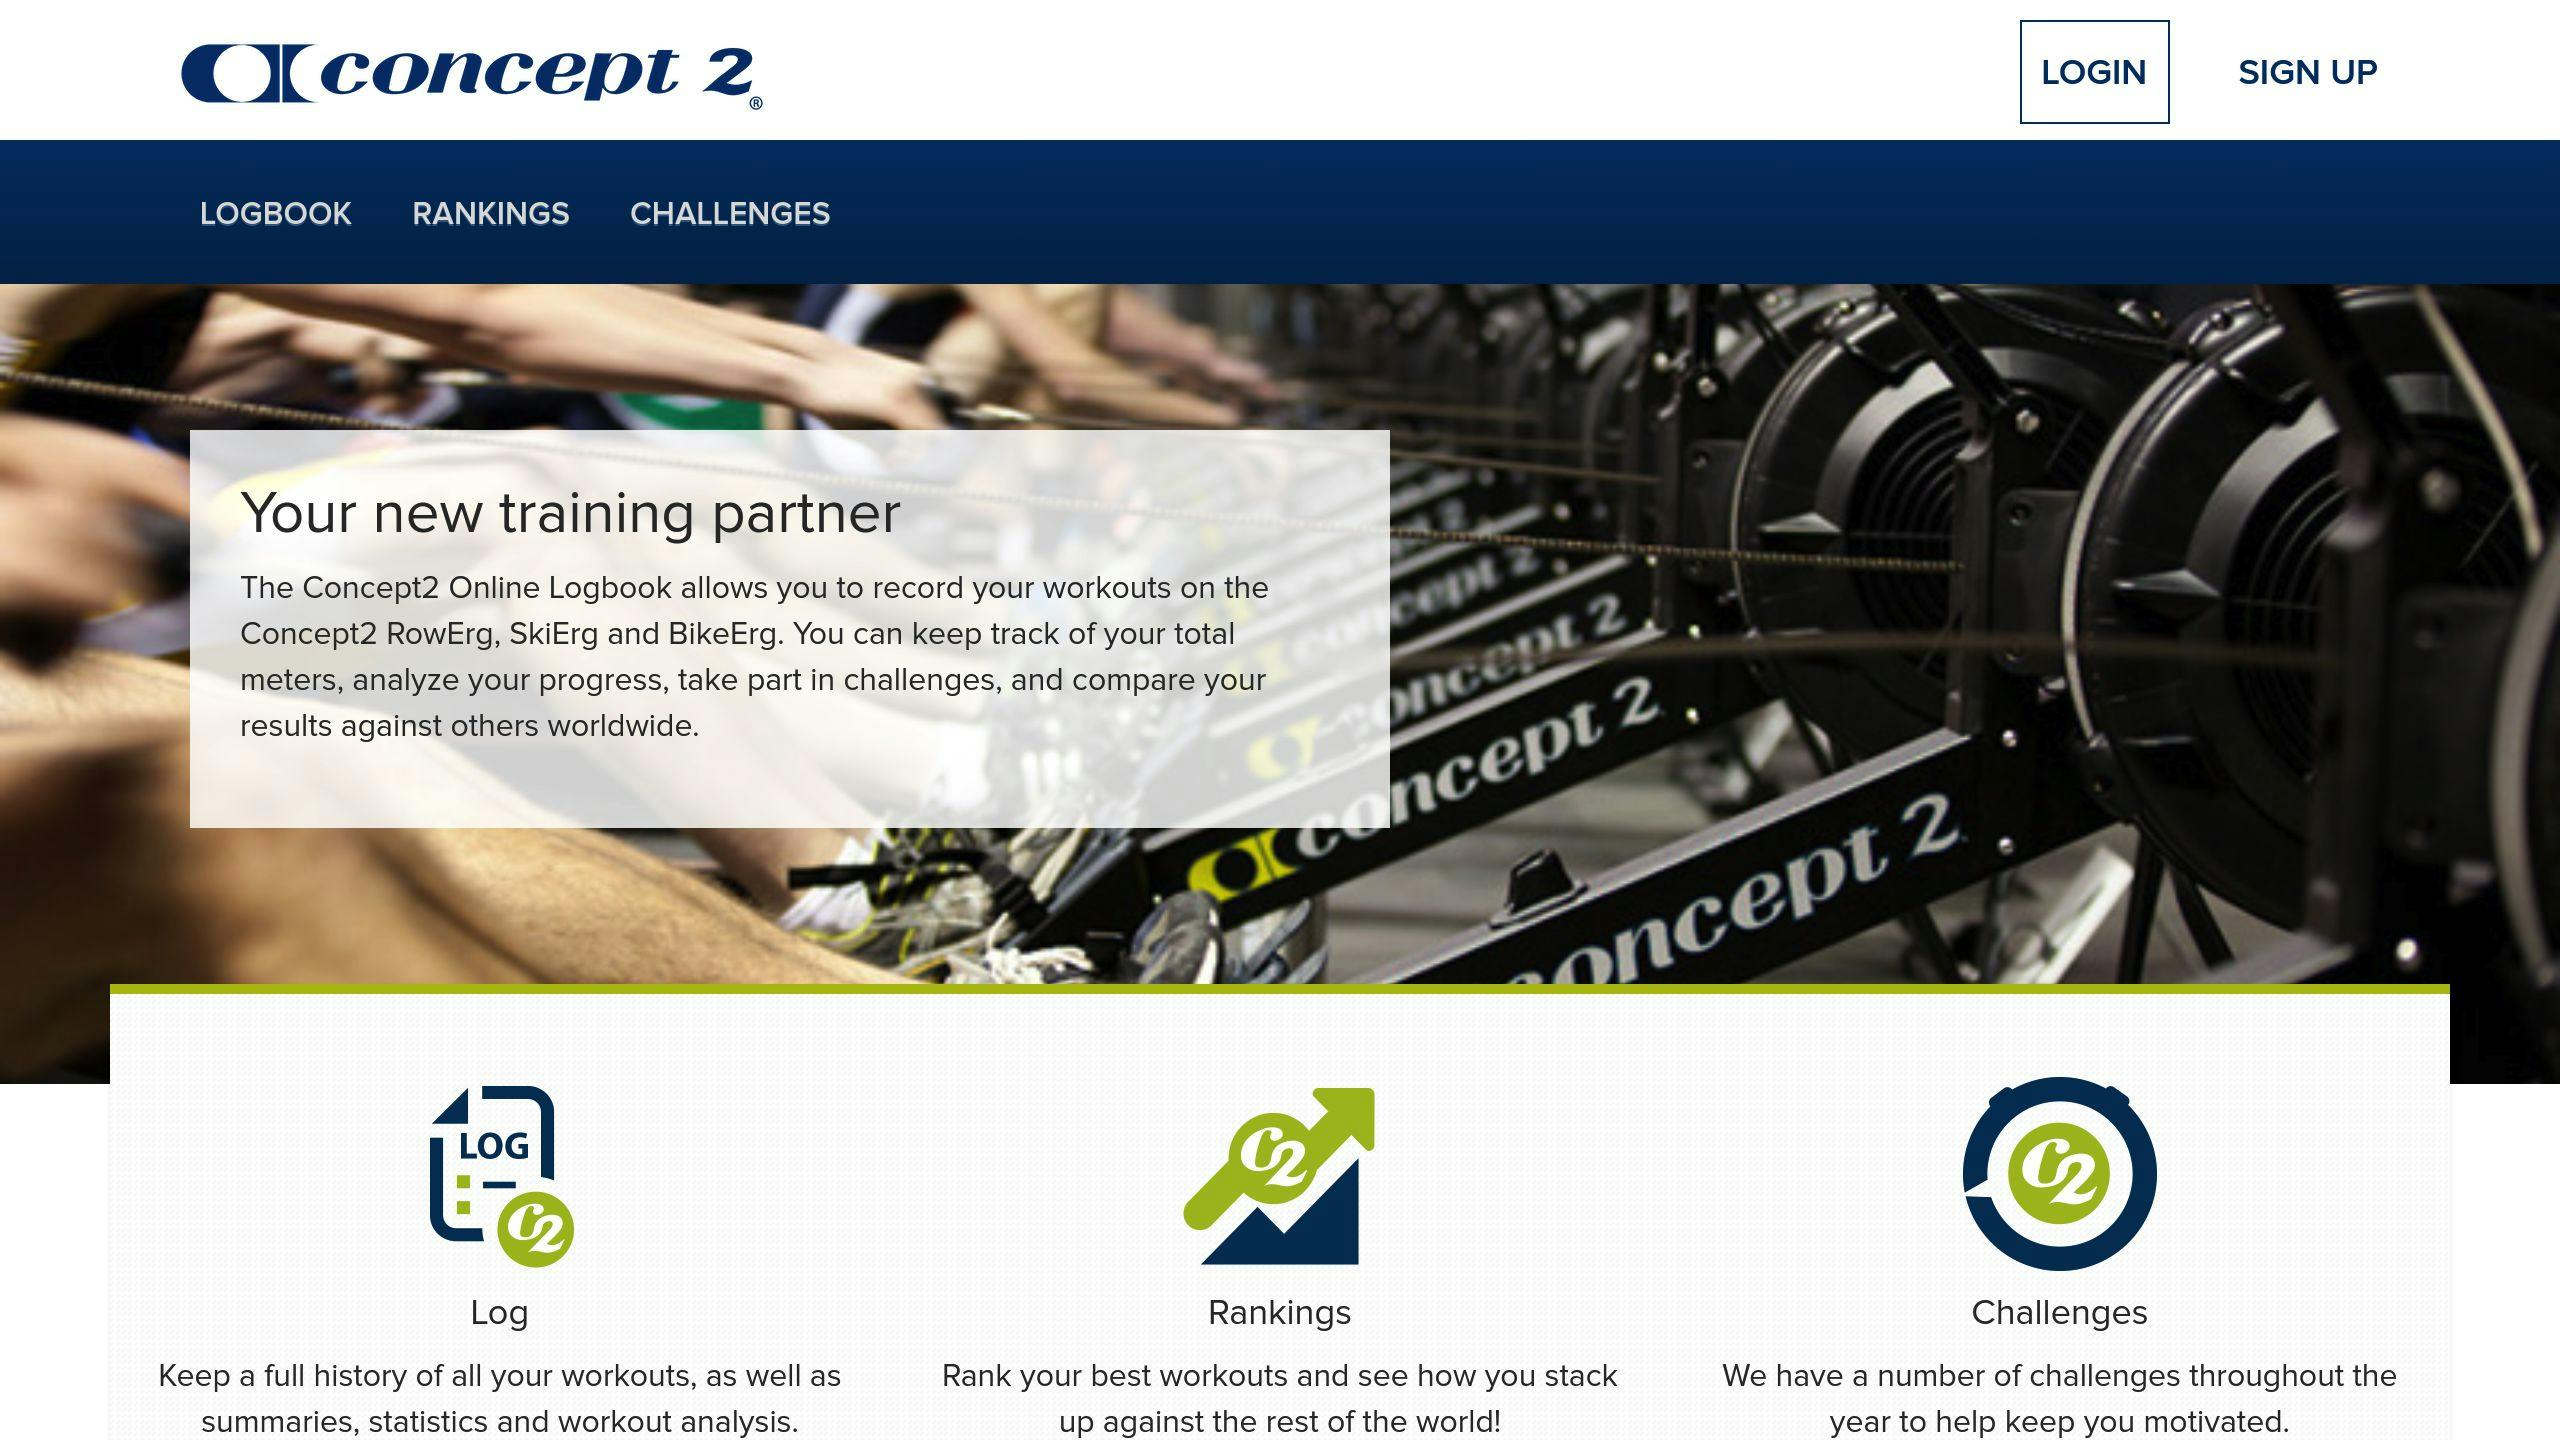
Concept2 Logbook Overview

The Concept2 Logbook is a must-have for dedicated rowers. It simplifies tracking by syncing automatically, so you don’t have to deal with manual data entry. The platform is easy to navigate and provides detailed workout analysis, making it easier to set goals and track your progress over time.
Features of RP3 Rowing Platform
The RP3 Platform focuses on detailed performance tracking and analysis. Some of its standout features include:
- Real-time feedback on your strokes
- Visual representation of power curves
- Automatic tracking of performance data
- Reports that detail your training progress
The live feedback feature is especially helpful for making quick adjustments to your technique during workouts, ensuring you get the most out of each session.
How ErgMonkey Can Help

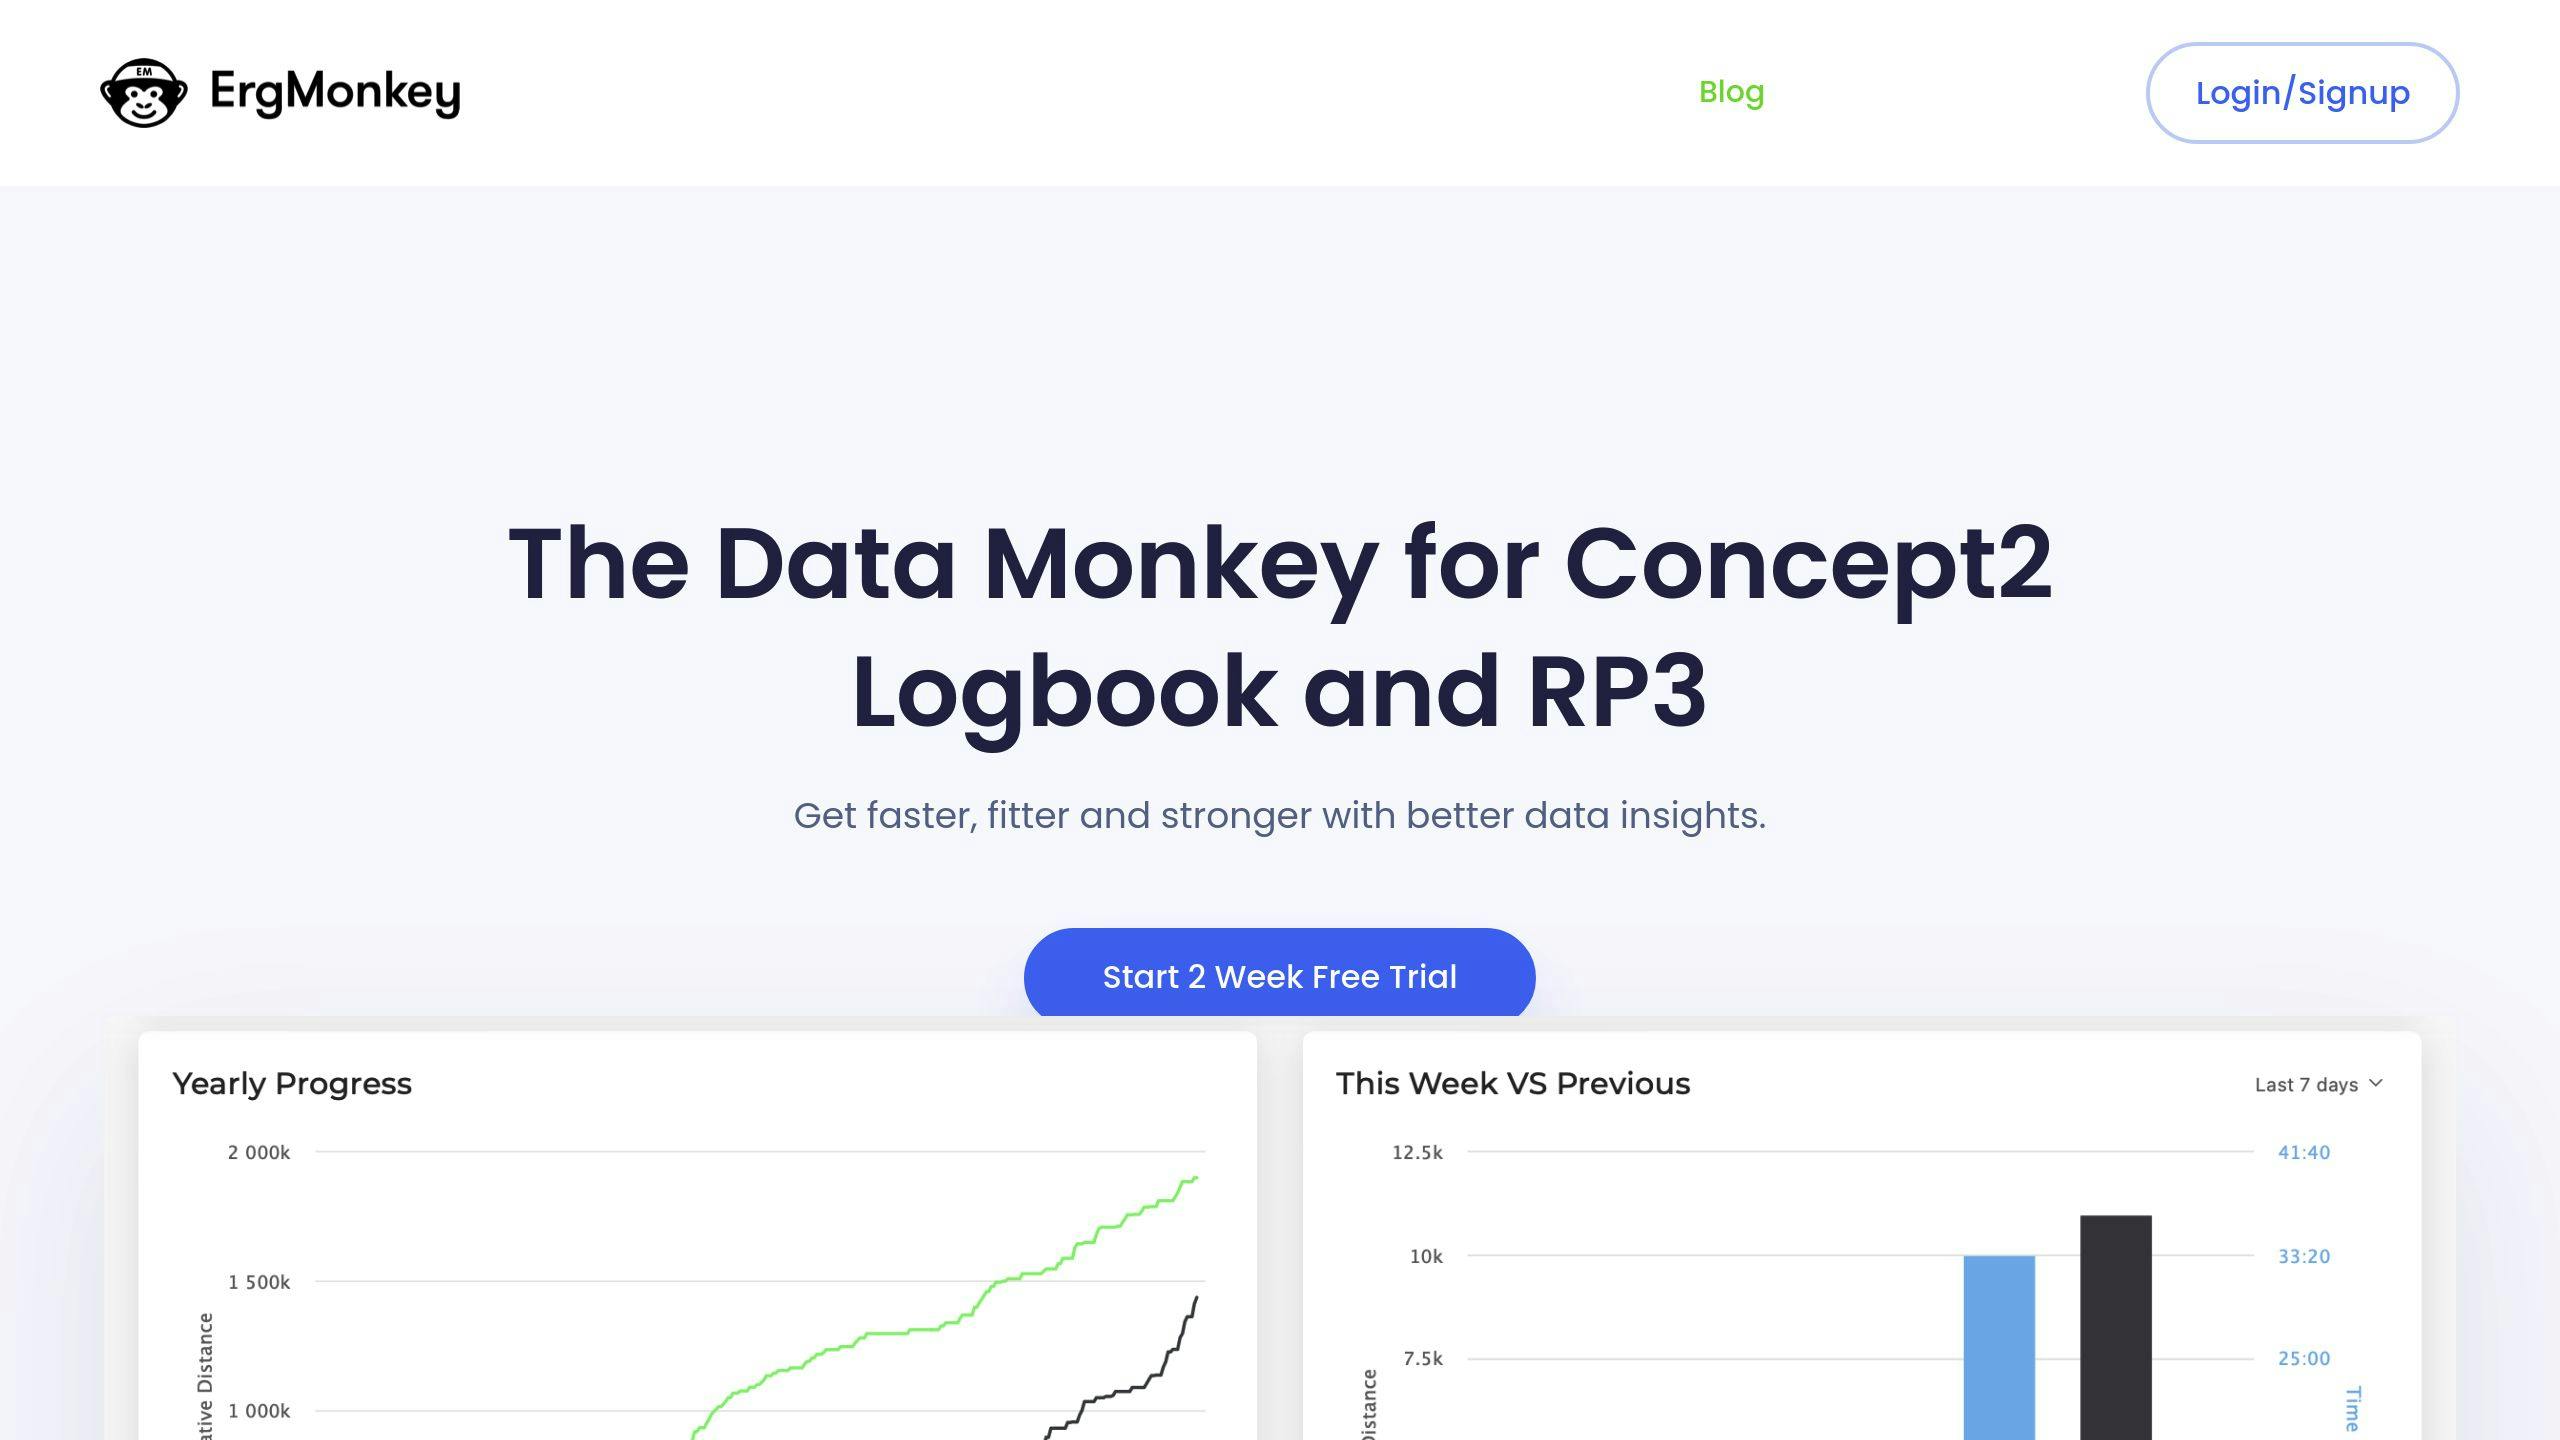
ErgMonkey brings together data from Concept2 and RP3, offering deeper insights and long-term tracking options. It comes in three versions: Lite (basic summaries), Standard (adds heart rate insights), and Plus (includes planning tools for training).
What sets ErgMonkey apart is its ability to compare workouts and analyze heart rate zones. The visual tools make it easy to spot performance trends and pinpoint areas for improvement. For athletes focusing on cardiovascular fitness, the heart rate analysis is particularly useful, providing details on training intensity and recovery.
These tools can help you stay on top of your rowing metrics and keep improving with every session.
Checklist for Monthly Rowing Progress
Weekly Tracking Checklist
| Metric | What to Track | Why It Matters |
|---|---|---|
| Distance | Total weekly meters | Measures endurance improvements |
| Stroke Rate | Average SPM per workout | Reflects rowing efficiency |
| Split Times | 500m split averages | Tracks power output and speed |
| Heart Rate | Time in each zone | Helps manage training intensity |
| Recovery | Rest days and sleep | Reduces risk of overtraining |
Use tools like the Concept2 Logbook or RP3 Platform to keep an eye on these metrics. ErgMonkey’s Standard plan also offers features like heart rate zone analysis and workout comparisons to make tracking easier.
Weekly tracking helps you stay consistent, but a monthly review gives you a bigger picture of your progress and highlights areas that need attention.
Monthly Review Checklist
-
Performance Analysis
Compare your weekly averages over the month. Look for trends in split times while keeping stroke rates steady. This helps you measure improvements in power and efficiency. -
Heart Rate and Recovery Analysis
Review the time spent in each heart rate zone to ensure your training intensity is on target. Compare heart rate data from similar workouts to assess recovery. If your heart rate is higher during comparable sessions, it might be a sign of overtraining – balancing effort and recovery is key. -
Volume Progress
Check your total distance for the month and see how it stacks up against previous months. A gradual increase of 5-10% in distance each month can help you improve steadily while minimizing the risk of injury. -
Training Adjustments
Use the insights from your monthly data to tweak your plan. Adjust stroke rates, intensity levels, distance goals, or recovery periods to stay on track and improve efficiently.
Conclusion: Keep Up with Rowing Metrics
Regularly tracking performance metrics with tools like Concept2’s Logbook and the RP3 Platform lays the groundwork for steady improvement. ErgMonkey’s Standard plan adds features like heart rate analysis and workout comparisons, making it easier to stay on top of your progress. These tools turn raw numbers into useful insights that help shape your training and recovery strategies.
Combining weekly check-ins with monthly reviews helps you maintain progress while avoiding overtraining or missing key trends. As one expert puts it:
"Tracking metrics ensures optimal intensity and injury prevention." [1][2]
The key is to focus on consistent tracking habits rather than aiming for quick fixes. Whether you prefer ErgMonkey’s interactive graphs, Concept2’s detailed session breakdowns, or RP3’s statistical summaries, pick tools that integrate smoothly into your routine. This makes it easier to stick with tracking and continue seeing measurable results [1][2].

