Have you ever wondered what your Heart Rate distribution for your indoor rowing workouts look like?
Our Heart Rate Report lets you look at your Heart Rate in a number of ways. Using the Heart Rate that is stored with your Logbook workout we are able to show you
- Distribution by zones
- Workout Distribution
- Average Heart Rate
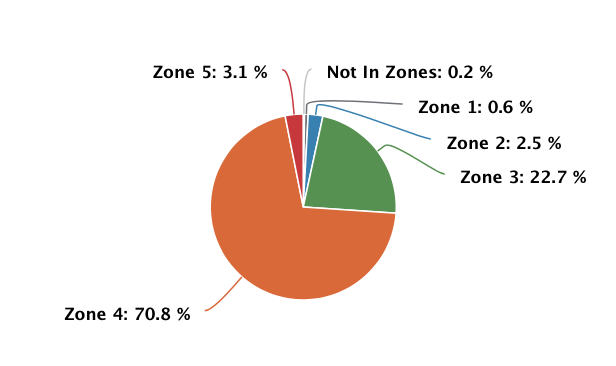
Heart Rate Distribution
Your heart rate distribution is shown as a pie chart. You are able to see your Heart Rate by each Zone from 1 – 5, as well as when you’re not in any of the zones. For each zone you can see the time spent in each.
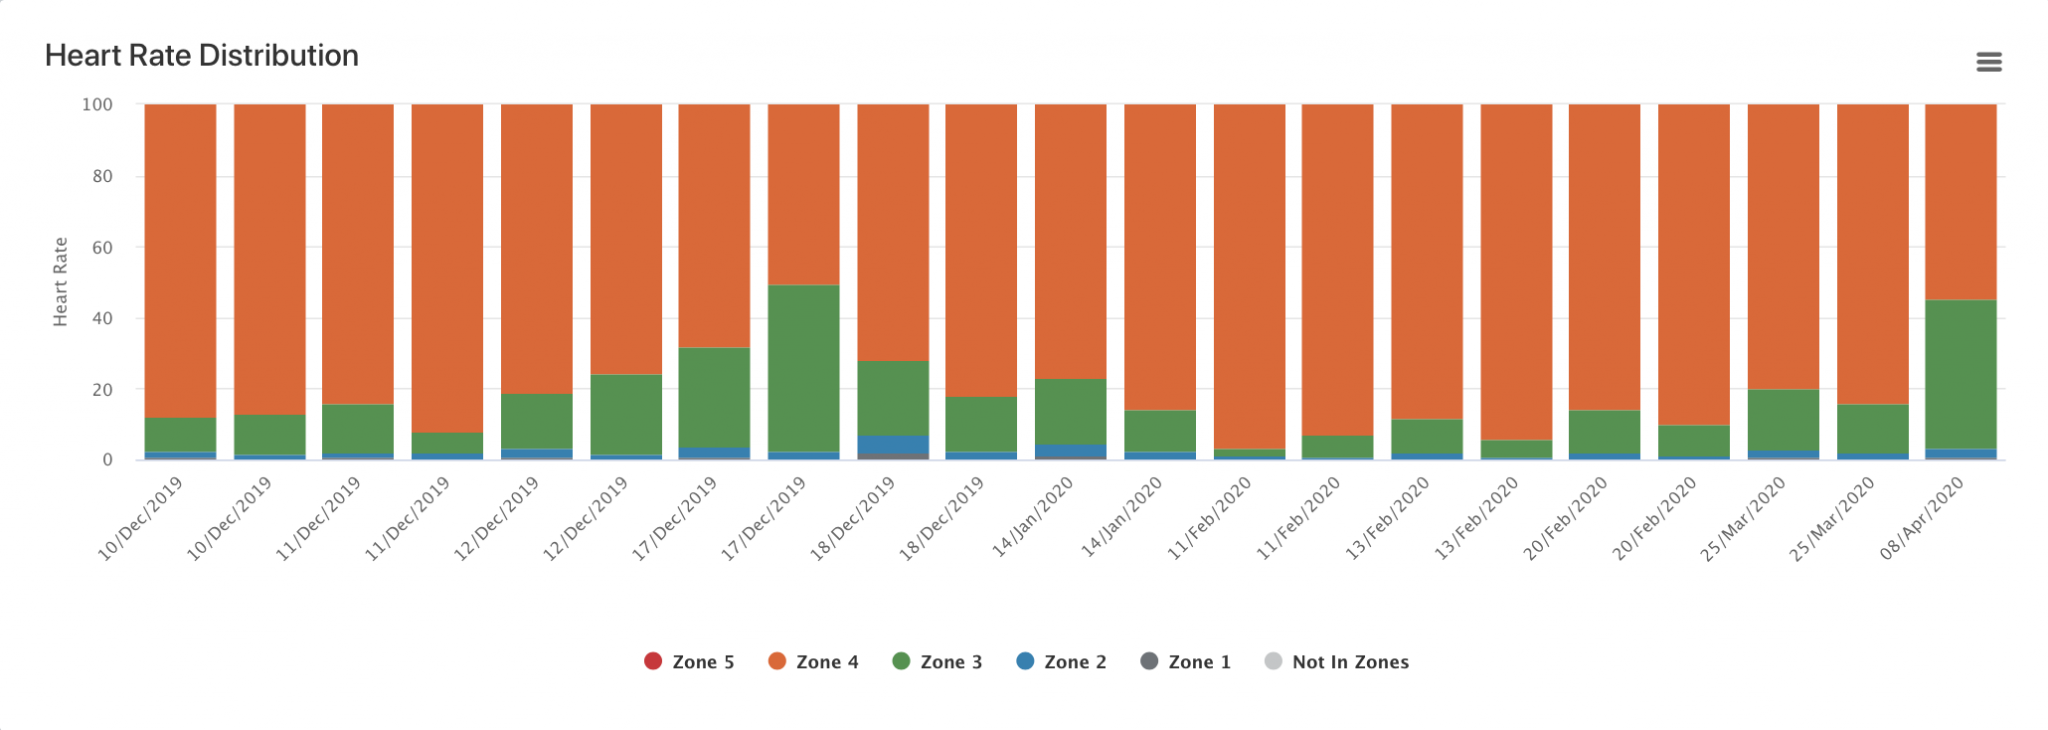
Your Workout Heart Rate Distribution
Here is what your Workout Heart Rate distribution will look like in ErgMonkey. We are able to give you a better understanding and picture of how your training is going.
This distribution shows a column for each workout so that you can easily compare your distribution over a longer period of time.

Depending on where you are in your training cycle your distribution might follow a specific pattern or it might show you general improvement of your fitness.
To help you understand what is happening, you can hover over or tap on any column to get more details, including your workout score.
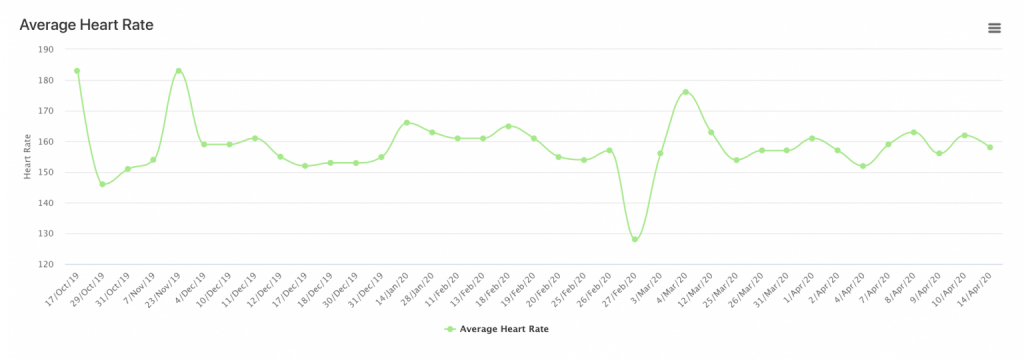
Track your average HR
The final chart that is show in the Heart Rate Report is the average Heart Rate for your training.